Zip Codes with the Highest Percentage of Population Employed in Accommodation & Food Services in Jacksonville, FL
RELATED REPORTS & OPTIONS
Accommodation & Food Services
Jacksonville
Compare Zip Codes
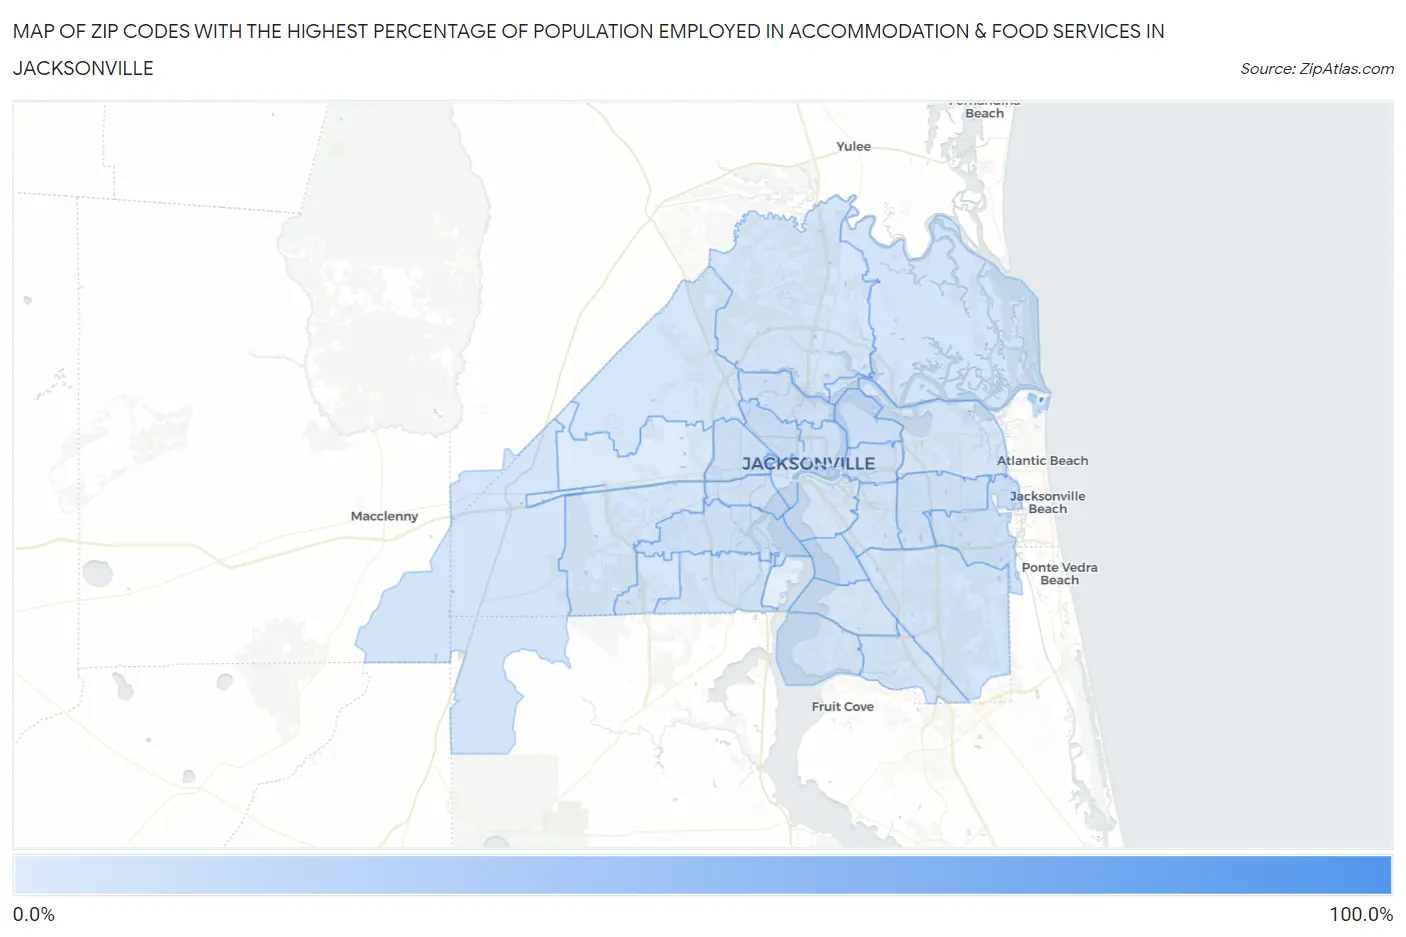
Map of Zip Codes with the Highest Percentage of Population Employed in Accommodation & Food Services in Jacksonville
3.6%
100.0%
Zip Codes with the Highest Percentage of Population Employed in Accommodation & Food Services in Jacksonville, FL
| Zip Code | % Employed | vs State | vs National | |
| 1. | 32228 | 100.0% | 8.4%(+91.6)#2 | 6.9%(+93.1)#4 |
| 2. | 32202 | 20.1% | 8.4%(+11.8)#17 | 6.9%(+13.3)#818 |
| 3. | 32227 | 16.4% | 8.4%(+7.99)#41 | 6.9%(+9.47)#1,376 |
| 4. | 32209 | 11.8% | 8.4%(+3.46)#138 | 6.9%(+4.95)#2,935 |
| 5. | 32254 | 10.9% | 8.4%(+2.57)#185 | 6.9%(+4.06)#3,600 |
| 6. | 32224 | 10.6% | 8.4%(+2.19)#206 | 6.9%(+3.68)#3,934 |
| 7. | 32217 | 10.5% | 8.4%(+2.17)#208 | 6.9%(+3.66)#3,952 |
| 8. | 32246 | 10.4% | 8.4%(+1.99)#220 | 6.9%(+3.48)#4,138 |
| 9. | 32206 | 10.3% | 8.4%(+1.93)#226 | 6.9%(+3.42)#4,196 |
| 10. | 32277 | 9.9% | 8.4%(+1.57)#262 | 6.9%(+3.06)#4,622 |
| 11. | 32210 | 9.6% | 8.4%(+1.20)#303 | 6.9%(+2.69)#5,117 |
| 12. | 32211 | 9.4% | 8.4%(+1.08)#307 | 6.9%(+2.57)#5,275 |
| 13. | 32208 | 9.3% | 8.4%(+0.974)#321 | 6.9%(+2.46)#5,435 |
| 14. | 32205 | 8.6% | 8.4%(+0.231)#392 | 6.9%(+1.72)#6,642 |
| 15. | 32216 | 8.4% | 8.4%(+0.036)#414 | 6.9%(+1.52)#6,983 |
| 16. | 32244 | 8.1% | 8.4%(-0.251)#448 | 6.9%(+1.24)#7,593 |
| 17. | 32226 | 8.1% | 8.4%(-0.285)#453 | 6.9%(+1.20)#7,650 |
| 18. | 32234 | 8.1% | 8.4%(-0.320)#455 | 6.9%(+1.17)#7,725 |
| 19. | 32256 | 8.0% | 8.4%(-0.381)#460 | 6.9%(+1.11)#7,838 |
| 20. | 32204 | 7.2% | 8.4%(-1.15)#543 | 6.9%(+0.339)#9,754 |
| 21. | 32219 | 6.7% | 8.4%(-1.66)#610 | 6.9%(-0.172)#11,186 |
| 22. | 32218 | 6.7% | 8.4%(-1.71)#614 | 6.9%(-0.217)#11,318 |
| 23. | 32223 | 6.6% | 8.4%(-1.74)#622 | 6.9%(-0.255)#11,432 |
| 24. | 32222 | 6.6% | 8.4%(-1.80)#628 | 6.9%(-0.308)#11,602 |
| 25. | 32221 | 6.5% | 8.4%(-1.88)#639 | 6.9%(-0.387)#11,871 |
| 26. | 32258 | 6.5% | 8.4%(-1.92)#645 | 6.9%(-0.426)#11,983 |
| 27. | 32225 | 6.1% | 8.4%(-2.32)#693 | 6.9%(-0.828)#13,291 |
| 28. | 32257 | 5.8% | 8.4%(-2.61)#722 | 6.9%(-1.12)#14,200 |
| 29. | 32207 | 5.5% | 8.4%(-2.84)#740 | 6.9%(-1.35)#14,963 |
| 30. | 32220 | 3.6% | 8.4%(-4.77)#883 | 6.9%(-3.28)#21,469 |
1
Common Questions
What are the Top 10 Zip Codes with the Highest Percentage of Population Employed in Accommodation & Food Services in Jacksonville, FL?
Top 10 Zip Codes with the Highest Percentage of Population Employed in Accommodation & Food Services in Jacksonville, FL are:
What zip code has the Highest Percentage of Population Employed in Accommodation & Food Services in Jacksonville, FL?
32228 has the Highest Percentage of Population Employed in Accommodation & Food Services in Jacksonville, FL with 100.0%.
What is the Percentage of Population Employed in Accommodation & Food Services in Jacksonville, FL?
Percentage of Population Employed in Accommodation & Food Services in Jacksonville is 8.3%.
What is the Percentage of Population Employed in Accommodation & Food Services in Florida?
Percentage of Population Employed in Accommodation & Food Services in Florida is 8.4%.
What is the Percentage of Population Employed in Accommodation & Food Services in the United States?
Percentage of Population Employed in Accommodation & Food Services in the United States is 6.9%.