Zip Codes with the Highest Percentage of Population Employed in Accommodation & Food Services in Davenport, FL
RELATED REPORTS & OPTIONS
Accommodation & Food Services
Davenport
Compare Zip Codes
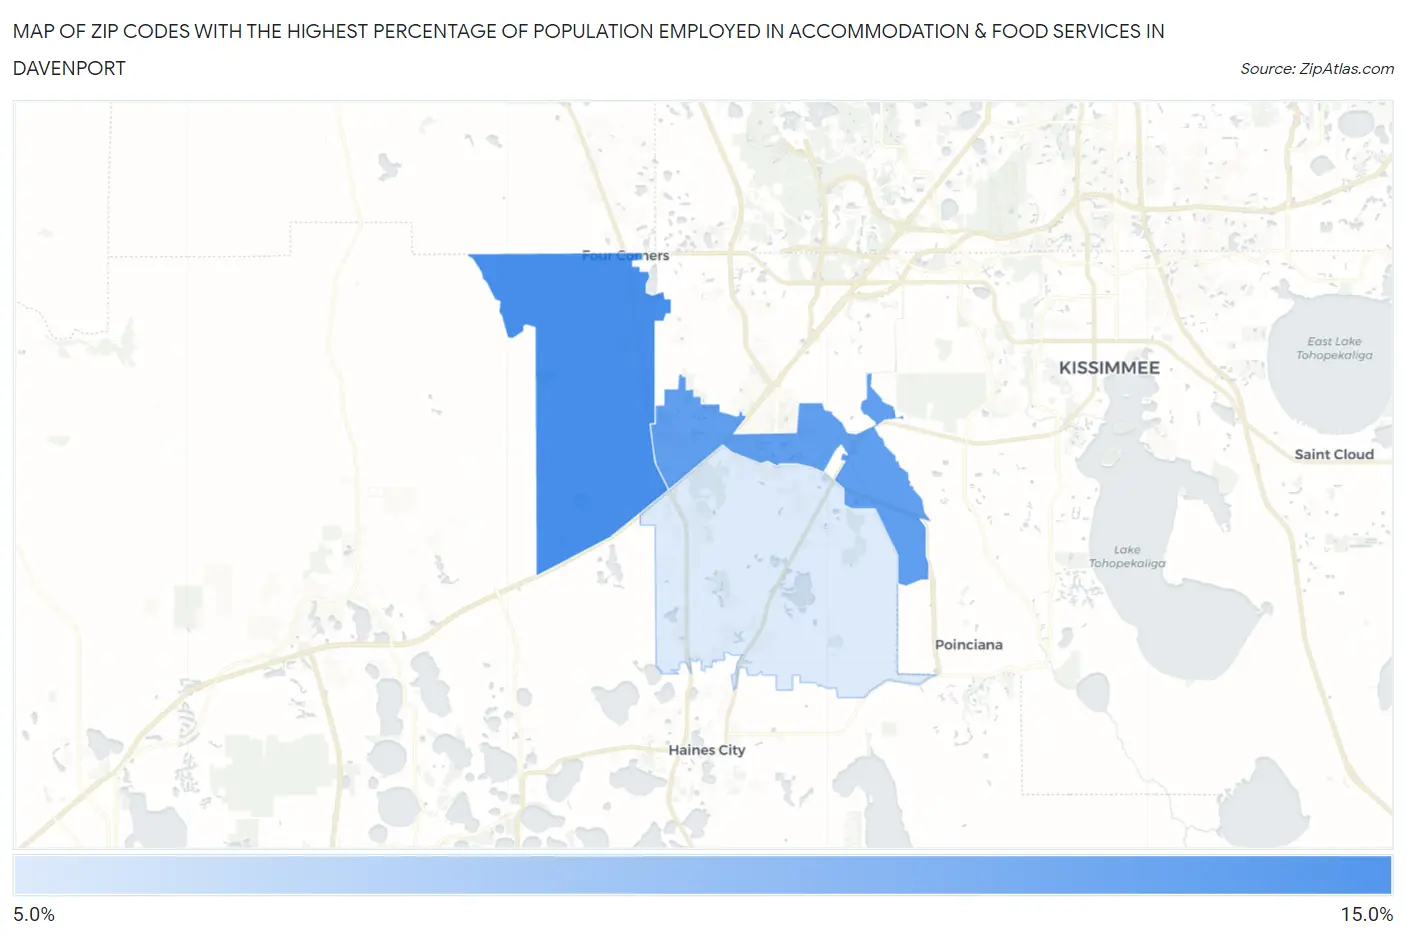
Map of Zip Codes with the Highest Percentage of Population Employed in Accommodation & Food Services in Davenport
9.9%
14.6%
Zip Codes with the Highest Percentage of Population Employed in Accommodation & Food Services in Davenport, FL
| Zip Code | % Employed | vs State | vs National | |
| 1. | 33897 | 14.6% | 8.4%(+6.21)#70 | 6.9%(+7.70)#1,796 |
| 2. | 33896 | 13.8% | 8.4%(+5.42)#79 | 6.9%(+6.91)#2,029 |
| 3. | 33837 | 9.9% | 8.4%(+1.57)#261 | 6.9%(+3.06)#4,615 |
1
Common Questions
What are the Top Zip Codes with the Highest Percentage of Population Employed in Accommodation & Food Services in Davenport, FL?
Top Zip Codes with the Highest Percentage of Population Employed in Accommodation & Food Services in Davenport, FL are:
What zip code has the Highest Percentage of Population Employed in Accommodation & Food Services in Davenport, FL?
33897 has the Highest Percentage of Population Employed in Accommodation & Food Services in Davenport, FL with 14.6%.
What is the Percentage of Population Employed in Accommodation & Food Services in Davenport, FL?
Percentage of Population Employed in Accommodation & Food Services in Davenport is 10.3%.
What is the Percentage of Population Employed in Accommodation & Food Services in Florida?
Percentage of Population Employed in Accommodation & Food Services in Florida is 8.4%.
What is the Percentage of Population Employed in Accommodation & Food Services in the United States?
Percentage of Population Employed in Accommodation & Food Services in the United States is 6.9%.