Tlingit-Haida vs Immigrants from Cabo Verde Average Family Size
COMPARE
Tlingit-Haida
Immigrants from Cabo Verde
Average Family Size
Average Family Size Comparison
Tlingit-Haida
Immigrants from Cabo Verde
3.16
AVERAGE FAMILY SIZE
0.7/ 100
METRIC RATING
270th/ 347
METRIC RANK
3.20
AVERAGE FAMILY SIZE
16.0/ 100
METRIC RATING
206th/ 347
METRIC RANK
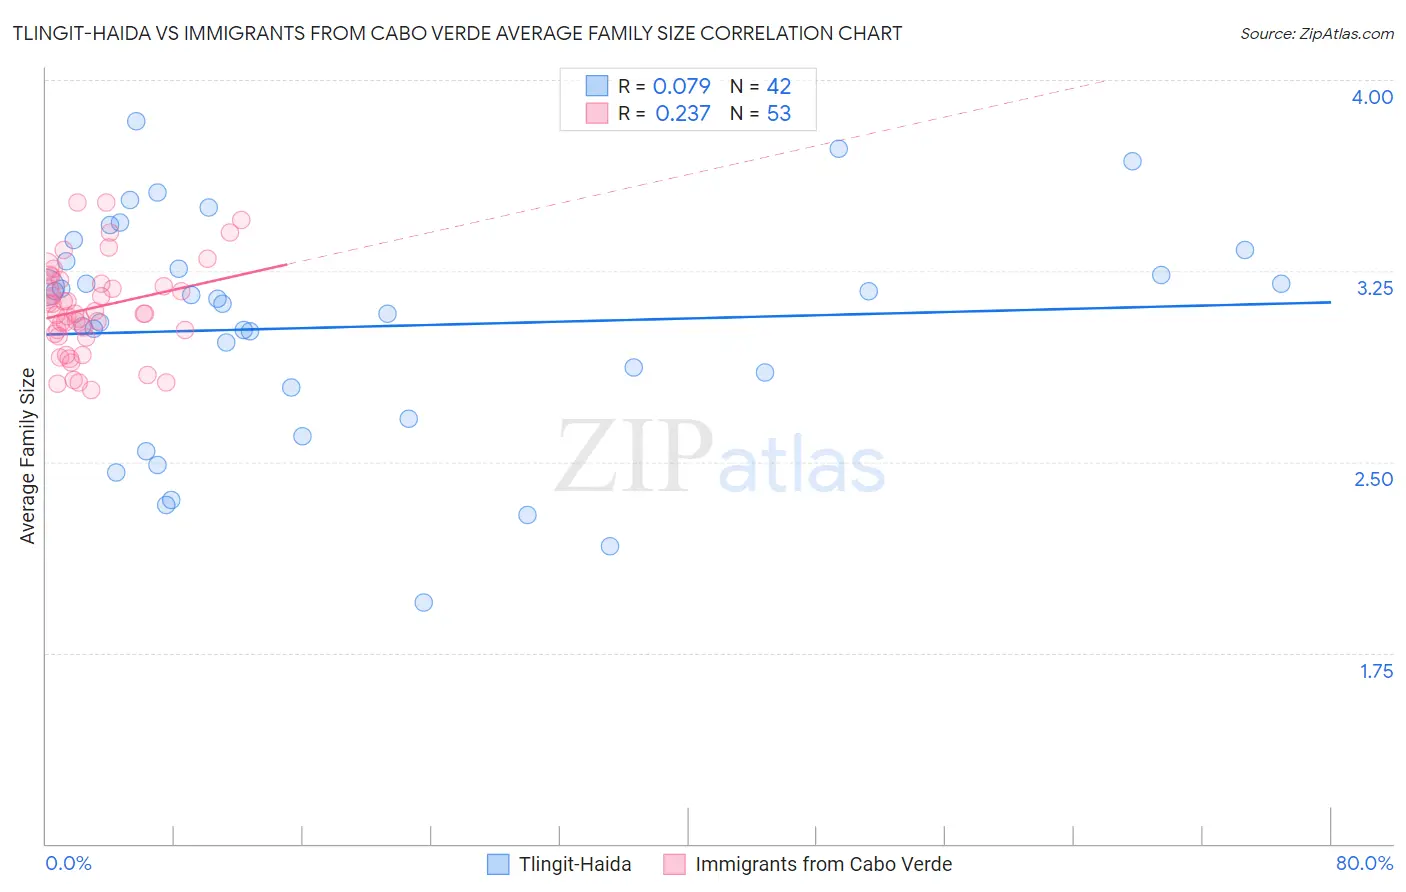
Tlingit-Haida vs Immigrants from Cabo Verde Average Family Size Correlation Chart
The statistical analysis conducted on geographies consisting of 60,855,605 people shows a slight positive correlation between the proportion of Tlingit-Haida and average family size in the United States with a correlation coefficient (R) of 0.079 and weighted average of 3.16. Similarly, the statistical analysis conducted on geographies consisting of 38,135,369 people shows a weak positive correlation between the proportion of Immigrants from Cabo Verde and average family size in the United States with a correlation coefficient (R) of 0.237 and weighted average of 3.20, a difference of 1.5%.
Average Family Size Correlation Summary
| Measurement | Tlingit-Haida | Immigrants from Cabo Verde |
| Minimum | 1.95 | 2.78 |
| Maximum | 3.84 | 3.52 |
| Range | 1.89 | 0.74 |
| Mean | 3.03 | 3.10 |
| Median | 3.13 | 3.08 |
| Interquartile 25% (IQ1) | 2.79 | 3.00 |
| Interquartile 75% (IQ3) | 3.29 | 3.21 |
| Interquartile Range (IQR) | 0.50 | 0.21 |
| Standard Deviation (Sample) | 0.44 | 0.18 |
| Standard Deviation (Population) | 0.43 | 0.18 |
Similar Demographics by Average Family Size
Demographics Similar to Tlingit-Haida by Average Family Size
In terms of average family size, the demographic groups most similar to Tlingit-Haida are Immigrants from Germany (3.15, a difference of 0.020%), Immigrants from Singapore (3.16, a difference of 0.030%), Maltese (3.16, a difference of 0.040%), Immigrants from Lithuania (3.15, a difference of 0.040%), and New Zealander (3.15, a difference of 0.060%).
| Demographics | Rating | Rank | Average Family Size |
| Immigrants | Bulgaria | 1.0 /100 | #263 | Tragic 3.16 |
| Americans | 1.0 /100 | #264 | Tragic 3.16 |
| Immigrants | South Africa | 0.9 /100 | #265 | Tragic 3.16 |
| Immigrants | Greece | 0.9 /100 | #266 | Tragic 3.16 |
| Iroquois | 0.8 /100 | #267 | Tragic 3.16 |
| Maltese | 0.8 /100 | #268 | Tragic 3.16 |
| Immigrants | Singapore | 0.7 /100 | #269 | Tragic 3.16 |
| Tlingit-Haida | 0.7 /100 | #270 | Tragic 3.16 |
| Immigrants | Germany | 0.7 /100 | #271 | Tragic 3.15 |
| Immigrants | Lithuania | 0.6 /100 | #272 | Tragic 3.15 |
| New Zealanders | 0.6 /100 | #273 | Tragic 3.15 |
| Immigrants | Belgium | 0.6 /100 | #274 | Tragic 3.15 |
| Cambodians | 0.6 /100 | #275 | Tragic 3.15 |
| Immigrants | Bosnia and Herzegovina | 0.5 /100 | #276 | Tragic 3.15 |
| Swiss | 0.5 /100 | #277 | Tragic 3.15 |
Demographics Similar to Immigrants from Cabo Verde by Average Family Size
In terms of average family size, the demographic groups most similar to Immigrants from Cabo Verde are Paraguayan (3.20, a difference of 0.010%), Immigrants from Poland (3.20, a difference of 0.020%), Immigrants from Nepal (3.21, a difference of 0.070%), Immigrants from Morocco (3.21, a difference of 0.080%), and Immigrants from India (3.21, a difference of 0.080%).
| Demographics | Rating | Rank | Average Family Size |
| Hmong | 20.7 /100 | #199 | Fair 3.21 |
| Immigrants | Kenya | 19.2 /100 | #200 | Poor 3.21 |
| Immigrants | Morocco | 18.5 /100 | #201 | Poor 3.21 |
| Immigrants | India | 18.5 /100 | #202 | Poor 3.21 |
| Immigrants | Nepal | 18.1 /100 | #203 | Poor 3.21 |
| Immigrants | Poland | 16.6 /100 | #204 | Poor 3.20 |
| Paraguayans | 16.3 /100 | #205 | Poor 3.20 |
| Immigrants | Cabo Verde | 16.0 /100 | #206 | Poor 3.20 |
| Filipinos | 13.6 /100 | #207 | Poor 3.20 |
| Chippewa | 13.3 /100 | #208 | Poor 3.20 |
| Sudanese | 13.3 /100 | #209 | Poor 3.20 |
| Zimbabweans | 12.6 /100 | #210 | Poor 3.20 |
| Immigrants | Iran | 12.1 /100 | #211 | Poor 3.20 |
| Creek | 12.1 /100 | #212 | Poor 3.20 |
| Mongolians | 11.5 /100 | #213 | Poor 3.20 |