Tlingit-Haida vs Immigrants from Yemen Average Family Size
COMPARE
Tlingit-Haida
Immigrants from Yemen
Average Family Size
Average Family Size Comparison
Tlingit-Haida
Immigrants from Yemen
3.16
AVERAGE FAMILY SIZE
0.7/ 100
METRIC RATING
270th/ 347
METRIC RANK
3.60
AVERAGE FAMILY SIZE
100.0/ 100
METRIC RATING
8th/ 347
METRIC RANK
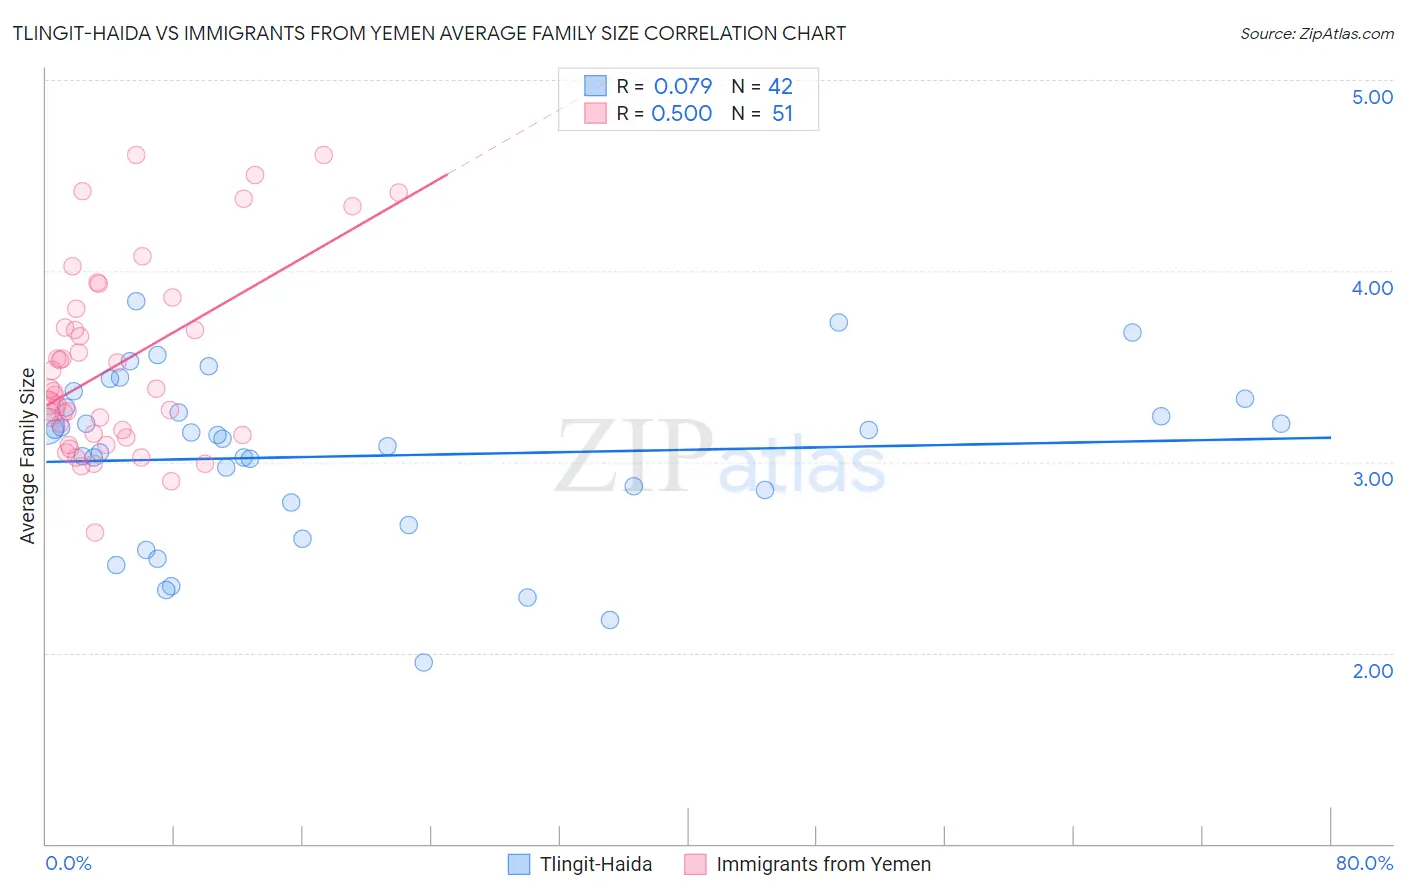
Tlingit-Haida vs Immigrants from Yemen Average Family Size Correlation Chart
The statistical analysis conducted on geographies consisting of 60,855,605 people shows a slight positive correlation between the proportion of Tlingit-Haida and average family size in the United States with a correlation coefficient (R) of 0.079 and weighted average of 3.16. Similarly, the statistical analysis conducted on geographies consisting of 82,433,611 people shows a moderate positive correlation between the proportion of Immigrants from Yemen and average family size in the United States with a correlation coefficient (R) of 0.500 and weighted average of 3.60, a difference of 14.0%.
Average Family Size Correlation Summary
| Measurement | Tlingit-Haida | Immigrants from Yemen |
| Minimum | 1.95 | 2.63 |
| Maximum | 3.84 | 4.61 |
| Range | 1.89 | 1.98 |
| Mean | 3.03 | 3.51 |
| Median | 3.13 | 3.37 |
| Interquartile 25% (IQ1) | 2.79 | 3.14 |
| Interquartile 75% (IQ3) | 3.29 | 3.80 |
| Interquartile Range (IQR) | 0.50 | 0.66 |
| Standard Deviation (Sample) | 0.44 | 0.49 |
| Standard Deviation (Population) | 0.43 | 0.49 |
Similar Demographics by Average Family Size
Demographics Similar to Tlingit-Haida by Average Family Size
In terms of average family size, the demographic groups most similar to Tlingit-Haida are Immigrants from Germany (3.15, a difference of 0.020%), Immigrants from Singapore (3.16, a difference of 0.030%), Maltese (3.16, a difference of 0.040%), Immigrants from Lithuania (3.15, a difference of 0.040%), and New Zealander (3.15, a difference of 0.060%).
| Demographics | Rating | Rank | Average Family Size |
| Immigrants | Bulgaria | 1.0 /100 | #263 | Tragic 3.16 |
| Americans | 1.0 /100 | #264 | Tragic 3.16 |
| Immigrants | South Africa | 0.9 /100 | #265 | Tragic 3.16 |
| Immigrants | Greece | 0.9 /100 | #266 | Tragic 3.16 |
| Iroquois | 0.8 /100 | #267 | Tragic 3.16 |
| Maltese | 0.8 /100 | #268 | Tragic 3.16 |
| Immigrants | Singapore | 0.7 /100 | #269 | Tragic 3.16 |
| Tlingit-Haida | 0.7 /100 | #270 | Tragic 3.16 |
| Immigrants | Germany | 0.7 /100 | #271 | Tragic 3.15 |
| Immigrants | Lithuania | 0.6 /100 | #272 | Tragic 3.15 |
| New Zealanders | 0.6 /100 | #273 | Tragic 3.15 |
| Immigrants | Belgium | 0.6 /100 | #274 | Tragic 3.15 |
| Cambodians | 0.6 /100 | #275 | Tragic 3.15 |
| Immigrants | Bosnia and Herzegovina | 0.5 /100 | #276 | Tragic 3.15 |
| Swiss | 0.5 /100 | #277 | Tragic 3.15 |
Demographics Similar to Immigrants from Yemen by Average Family Size
In terms of average family size, the demographic groups most similar to Immigrants from Yemen are Hopi (3.60, a difference of 0.010%), Spanish American Indian (3.58, a difference of 0.36%), Inupiat (3.63, a difference of 0.87%), Arapaho (3.64, a difference of 1.1%), and Navajo (3.65, a difference of 1.3%).
| Demographics | Rating | Rank | Average Family Size |
| Yup'ik | 100 /100 | #1 | Exceptional 4.00 |
| Crow | 100 /100 | #2 | Exceptional 3.82 |
| Pueblo | 100 /100 | #3 | Exceptional 3.79 |
| Pima | 100 /100 | #4 | Exceptional 3.75 |
| Navajo | 100.0 /100 | #5 | Exceptional 3.65 |
| Arapaho | 100.0 /100 | #6 | Exceptional 3.64 |
| Inupiat | 100.0 /100 | #7 | Exceptional 3.63 |
| Immigrants | Yemen | 100.0 /100 | #8 | Exceptional 3.60 |
| Hopi | 100.0 /100 | #9 | Exceptional 3.60 |
| Spanish American Indians | 100.0 /100 | #10 | Exceptional 3.58 |
| Tohono O'odham | 100.0 /100 | #11 | Exceptional 3.53 |
| Immigrants | Mexico | 100.0 /100 | #12 | Exceptional 3.52 |
| Sioux | 100.0 /100 | #13 | Exceptional 3.52 |
| Immigrants | Central America | 100.0 /100 | #14 | Exceptional 3.49 |
| Tongans | 100.0 /100 | #15 | Exceptional 3.49 |