Tlingit-Haida vs Immigrants from Ethiopia Average Family Size
COMPARE
Tlingit-Haida
Immigrants from Ethiopia
Average Family Size
Average Family Size Comparison
Tlingit-Haida
Immigrants from Ethiopia
3.16
AVERAGE FAMILY SIZE
0.7/ 100
METRIC RATING
270th/ 347
METRIC RANK
3.25
AVERAGE FAMILY SIZE
81.6/ 100
METRIC RATING
139th/ 347
METRIC RANK
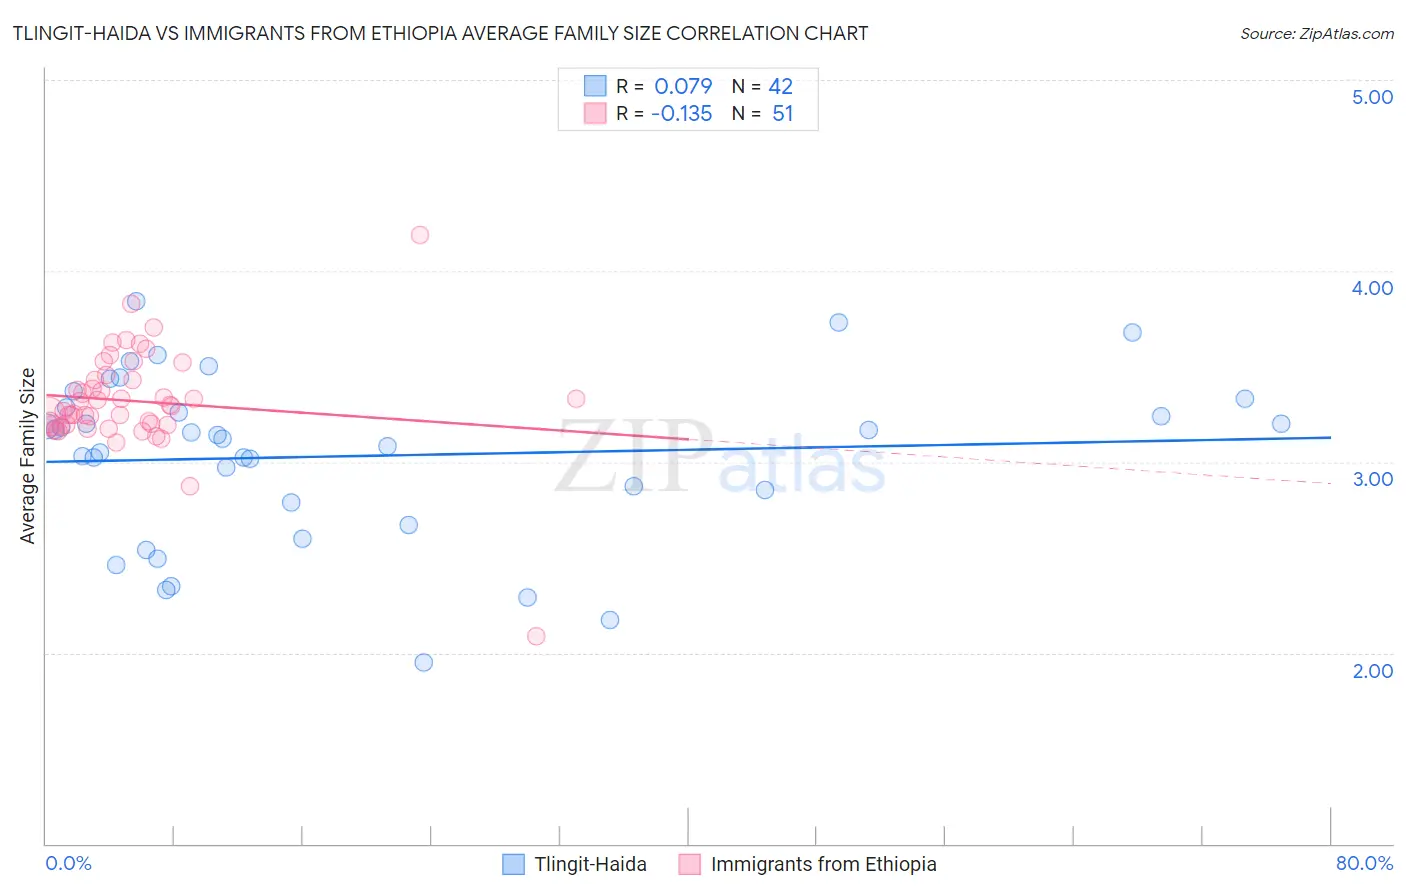
Tlingit-Haida vs Immigrants from Ethiopia Average Family Size Correlation Chart
The statistical analysis conducted on geographies consisting of 60,855,605 people shows a slight positive correlation between the proportion of Tlingit-Haida and average family size in the United States with a correlation coefficient (R) of 0.079 and weighted average of 3.16. Similarly, the statistical analysis conducted on geographies consisting of 211,454,545 people shows a poor negative correlation between the proportion of Immigrants from Ethiopia and average family size in the United States with a correlation coefficient (R) of -0.135 and weighted average of 3.25, a difference of 3.0%.
Average Family Size Correlation Summary
| Measurement | Tlingit-Haida | Immigrants from Ethiopia |
| Minimum | 1.95 | 2.09 |
| Maximum | 3.84 | 4.19 |
| Range | 1.89 | 2.10 |
| Mean | 3.03 | 3.32 |
| Median | 3.13 | 3.29 |
| Interquartile 25% (IQ1) | 2.79 | 3.19 |
| Interquartile 75% (IQ3) | 3.29 | 3.43 |
| Interquartile Range (IQR) | 0.50 | 0.24 |
| Standard Deviation (Sample) | 0.44 | 0.28 |
| Standard Deviation (Population) | 0.43 | 0.28 |
Similar Demographics by Average Family Size
Demographics Similar to Tlingit-Haida by Average Family Size
In terms of average family size, the demographic groups most similar to Tlingit-Haida are Immigrants from Germany (3.15, a difference of 0.020%), Immigrants from Singapore (3.16, a difference of 0.030%), Maltese (3.16, a difference of 0.040%), Immigrants from Lithuania (3.15, a difference of 0.040%), and New Zealander (3.15, a difference of 0.060%).
| Demographics | Rating | Rank | Average Family Size |
| Immigrants | Bulgaria | 1.0 /100 | #263 | Tragic 3.16 |
| Americans | 1.0 /100 | #264 | Tragic 3.16 |
| Immigrants | South Africa | 0.9 /100 | #265 | Tragic 3.16 |
| Immigrants | Greece | 0.9 /100 | #266 | Tragic 3.16 |
| Iroquois | 0.8 /100 | #267 | Tragic 3.16 |
| Maltese | 0.8 /100 | #268 | Tragic 3.16 |
| Immigrants | Singapore | 0.7 /100 | #269 | Tragic 3.16 |
| Tlingit-Haida | 0.7 /100 | #270 | Tragic 3.16 |
| Immigrants | Germany | 0.7 /100 | #271 | Tragic 3.15 |
| Immigrants | Lithuania | 0.6 /100 | #272 | Tragic 3.15 |
| New Zealanders | 0.6 /100 | #273 | Tragic 3.15 |
| Immigrants | Belgium | 0.6 /100 | #274 | Tragic 3.15 |
| Cambodians | 0.6 /100 | #275 | Tragic 3.15 |
| Immigrants | Bosnia and Herzegovina | 0.5 /100 | #276 | Tragic 3.15 |
| Swiss | 0.5 /100 | #277 | Tragic 3.15 |
Demographics Similar to Immigrants from Ethiopia by Average Family Size
In terms of average family size, the demographic groups most similar to Immigrants from Ethiopia are Subsaharan African (3.25, a difference of 0.0%), Cuban (3.25, a difference of 0.010%), Venezuelan (3.25, a difference of 0.010%), Liberian (3.25, a difference of 0.010%), and Immigrants from Middle Africa (3.25, a difference of 0.020%).
| Demographics | Rating | Rank | Average Family Size |
| Costa Ricans | 86.8 /100 | #132 | Excellent 3.26 |
| Immigrants | Venezuela | 86.3 /100 | #133 | Excellent 3.26 |
| Africans | 84.9 /100 | #134 | Excellent 3.25 |
| Panamanians | 84.2 /100 | #135 | Excellent 3.25 |
| Comanche | 82.8 /100 | #136 | Excellent 3.25 |
| Immigrants | Middle Africa | 82.4 /100 | #137 | Excellent 3.25 |
| Cubans | 81.8 /100 | #138 | Excellent 3.25 |
| Immigrants | Ethiopia | 81.6 /100 | #139 | Excellent 3.25 |
| Sub-Saharan Africans | 81.6 /100 | #140 | Excellent 3.25 |
| Venezuelans | 81.4 /100 | #141 | Excellent 3.25 |
| Liberians | 81.2 /100 | #142 | Excellent 3.25 |
| Bhutanese | 81.0 /100 | #143 | Excellent 3.25 |
| Tsimshian | 80.2 /100 | #144 | Excellent 3.25 |
| Armenians | 78.2 /100 | #145 | Good 3.25 |
| Immigrants | Africa | 77.9 /100 | #146 | Good 3.25 |