Tlingit-Haida vs U.S. Virgin Islander Average Family Size
COMPARE
Tlingit-Haida
U.S. Virgin Islander
Average Family Size
Average Family Size Comparison
Tlingit-Haida
U.S. Virgin Islanders
3.16
AVERAGE FAMILY SIZE
0.7/ 100
METRIC RATING
270th/ 347
METRIC RANK
3.29
AVERAGE FAMILY SIZE
98.8/ 100
METRIC RATING
96th/ 347
METRIC RANK
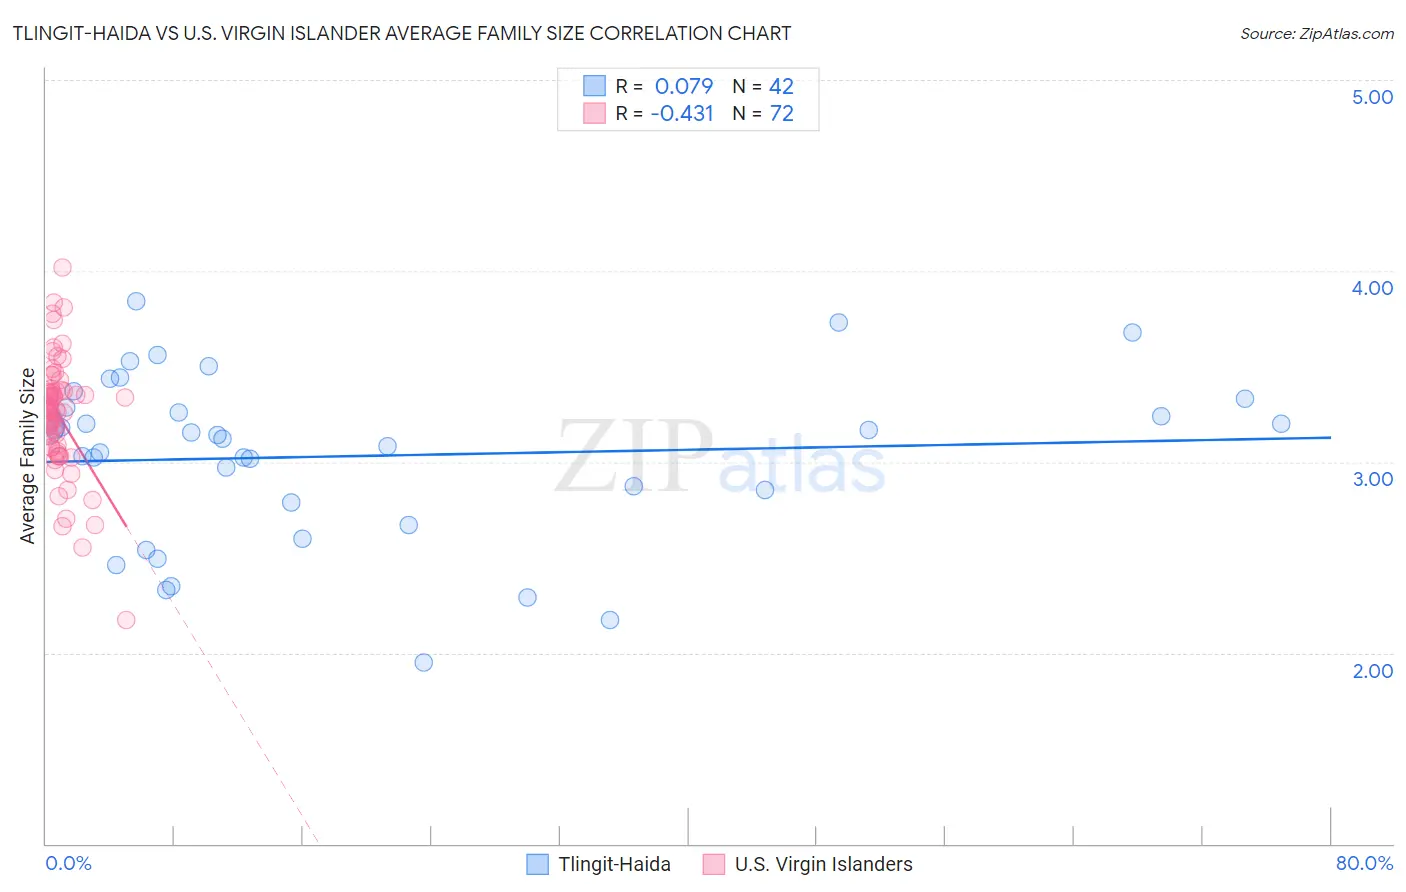
Tlingit-Haida vs U.S. Virgin Islander Average Family Size Correlation Chart
The statistical analysis conducted on geographies consisting of 60,855,605 people shows a slight positive correlation between the proportion of Tlingit-Haida and average family size in the United States with a correlation coefficient (R) of 0.079 and weighted average of 3.16. Similarly, the statistical analysis conducted on geographies consisting of 87,507,759 people shows a moderate negative correlation between the proportion of U.S. Virgin Islanders and average family size in the United States with a correlation coefficient (R) of -0.431 and weighted average of 3.29, a difference of 4.3%.
Average Family Size Correlation Summary
| Measurement | Tlingit-Haida | U.S. Virgin Islander |
| Minimum | 1.95 | 2.17 |
| Maximum | 3.84 | 4.02 |
| Range | 1.89 | 1.85 |
| Mean | 3.03 | 3.24 |
| Median | 3.13 | 3.27 |
| Interquartile 25% (IQ1) | 2.79 | 3.08 |
| Interquartile 75% (IQ3) | 3.29 | 3.37 |
| Interquartile Range (IQR) | 0.50 | 0.29 |
| Standard Deviation (Sample) | 0.44 | 0.30 |
| Standard Deviation (Population) | 0.43 | 0.30 |
Similar Demographics by Average Family Size
Demographics Similar to Tlingit-Haida by Average Family Size
In terms of average family size, the demographic groups most similar to Tlingit-Haida are Immigrants from Germany (3.15, a difference of 0.020%), Immigrants from Singapore (3.16, a difference of 0.030%), Maltese (3.16, a difference of 0.040%), Immigrants from Lithuania (3.15, a difference of 0.040%), and New Zealander (3.15, a difference of 0.060%).
| Demographics | Rating | Rank | Average Family Size |
| Immigrants | Bulgaria | 1.0 /100 | #263 | Tragic 3.16 |
| Americans | 1.0 /100 | #264 | Tragic 3.16 |
| Immigrants | South Africa | 0.9 /100 | #265 | Tragic 3.16 |
| Immigrants | Greece | 0.9 /100 | #266 | Tragic 3.16 |
| Iroquois | 0.8 /100 | #267 | Tragic 3.16 |
| Maltese | 0.8 /100 | #268 | Tragic 3.16 |
| Immigrants | Singapore | 0.7 /100 | #269 | Tragic 3.16 |
| Tlingit-Haida | 0.7 /100 | #270 | Tragic 3.16 |
| Immigrants | Germany | 0.7 /100 | #271 | Tragic 3.15 |
| Immigrants | Lithuania | 0.6 /100 | #272 | Tragic 3.15 |
| New Zealanders | 0.6 /100 | #273 | Tragic 3.15 |
| Immigrants | Belgium | 0.6 /100 | #274 | Tragic 3.15 |
| Cambodians | 0.6 /100 | #275 | Tragic 3.15 |
| Immigrants | Bosnia and Herzegovina | 0.5 /100 | #276 | Tragic 3.15 |
| Swiss | 0.5 /100 | #277 | Tragic 3.15 |
Demographics Similar to U.S. Virgin Islanders by Average Family Size
In terms of average family size, the demographic groups most similar to U.S. Virgin Islanders are Immigrants from Oceania (3.29, a difference of 0.040%), Barbadian (3.29, a difference of 0.040%), Nigerian (3.29, a difference of 0.050%), Guamanian/Chamorro (3.29, a difference of 0.050%), and Immigrants from Burma/Myanmar (3.29, a difference of 0.070%).
| Demographics | Rating | Rank | Average Family Size |
| Malaysians | 99.6 /100 | #89 | Exceptional 3.31 |
| Menominee | 99.4 /100 | #90 | Exceptional 3.30 |
| Immigrants | Pakistan | 99.2 /100 | #91 | Exceptional 3.30 |
| Immigrants | Cameroon | 99.2 /100 | #92 | Exceptional 3.30 |
| Peruvians | 99.2 /100 | #93 | Exceptional 3.30 |
| Sierra Leoneans | 99.0 /100 | #94 | Exceptional 3.30 |
| Immigrants | Lebanon | 99.0 /100 | #95 | Exceptional 3.30 |
| U.S. Virgin Islanders | 98.8 /100 | #96 | Exceptional 3.29 |
| Immigrants | Oceania | 98.7 /100 | #97 | Exceptional 3.29 |
| Barbadians | 98.6 /100 | #98 | Exceptional 3.29 |
| Nigerians | 98.6 /100 | #99 | Exceptional 3.29 |
| Guamanians/Chamorros | 98.6 /100 | #100 | Exceptional 3.29 |
| Immigrants | Burma/Myanmar | 98.6 /100 | #101 | Exceptional 3.29 |
| West Indians | 98.5 /100 | #102 | Exceptional 3.29 |
| Immigrants | Western Africa | 98.4 /100 | #103 | Exceptional 3.29 |