Tlingit-Haida vs Immigrants from Uganda Average Family Size
COMPARE
Tlingit-Haida
Immigrants from Uganda
Average Family Size
Average Family Size Comparison
Tlingit-Haida
Immigrants from Uganda
3.16
AVERAGE FAMILY SIZE
0.7/ 100
METRIC RATING
270th/ 347
METRIC RANK
3.23
AVERAGE FAMILY SIZE
60.1/ 100
METRIC RATING
162nd/ 347
METRIC RANK
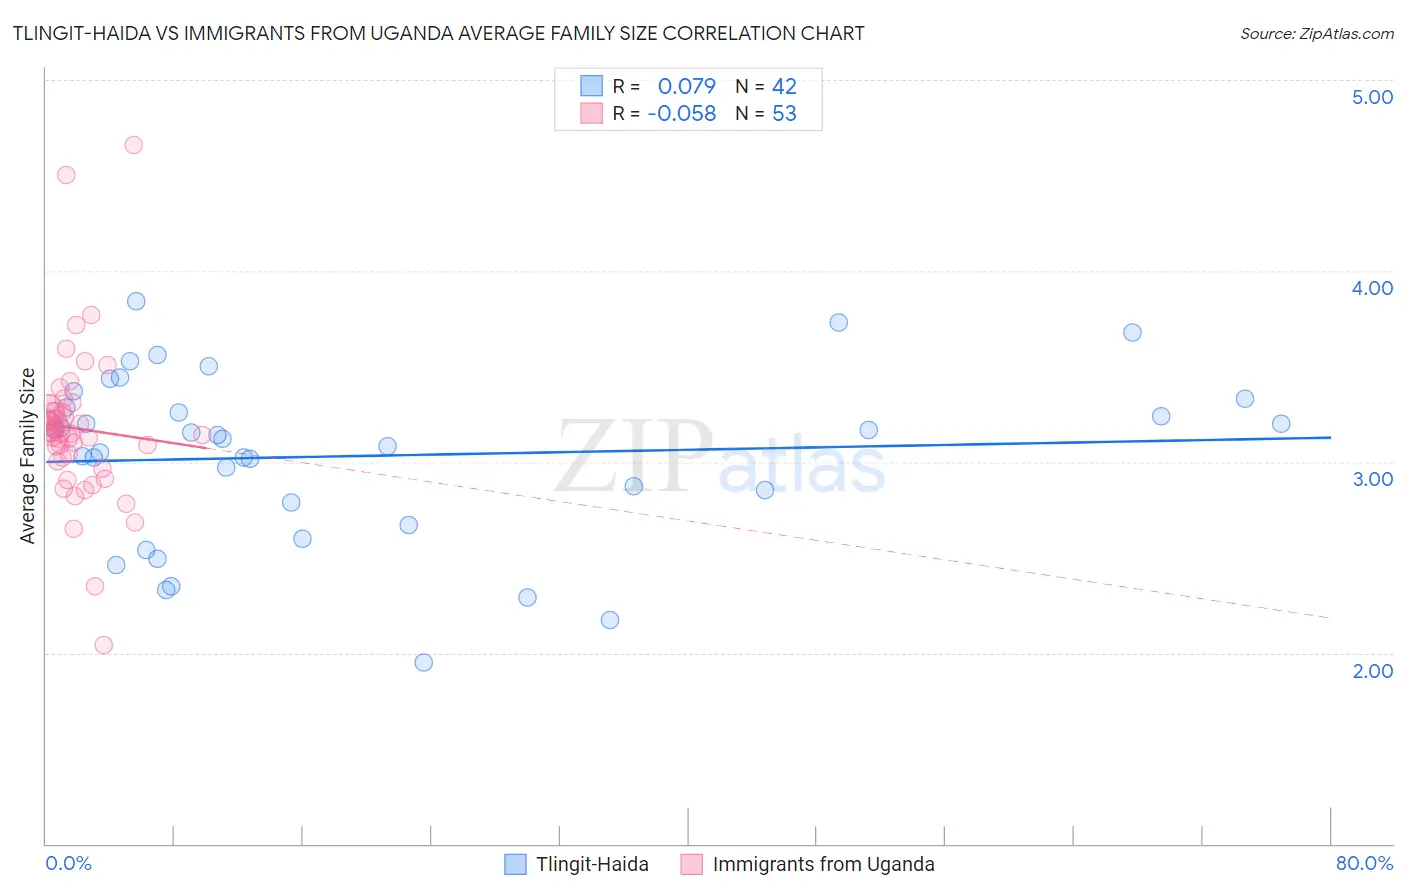
Tlingit-Haida vs Immigrants from Uganda Average Family Size Correlation Chart
The statistical analysis conducted on geographies consisting of 60,855,605 people shows a slight positive correlation between the proportion of Tlingit-Haida and average family size in the United States with a correlation coefficient (R) of 0.079 and weighted average of 3.16. Similarly, the statistical analysis conducted on geographies consisting of 125,974,533 people shows a slight negative correlation between the proportion of Immigrants from Uganda and average family size in the United States with a correlation coefficient (R) of -0.058 and weighted average of 3.23, a difference of 2.5%.
Average Family Size Correlation Summary
| Measurement | Tlingit-Haida | Immigrants from Uganda |
| Minimum | 1.95 | 2.04 |
| Maximum | 3.84 | 4.66 |
| Range | 1.89 | 2.62 |
| Mean | 3.03 | 3.18 |
| Median | 3.13 | 3.15 |
| Interquartile 25% (IQ1) | 2.79 | 3.01 |
| Interquartile 75% (IQ3) | 3.29 | 3.27 |
| Interquartile Range (IQR) | 0.50 | 0.25 |
| Standard Deviation (Sample) | 0.44 | 0.41 |
| Standard Deviation (Population) | 0.43 | 0.40 |
Similar Demographics by Average Family Size
Demographics Similar to Tlingit-Haida by Average Family Size
In terms of average family size, the demographic groups most similar to Tlingit-Haida are Immigrants from Germany (3.15, a difference of 0.020%), Immigrants from Singapore (3.16, a difference of 0.030%), Maltese (3.16, a difference of 0.040%), Immigrants from Lithuania (3.15, a difference of 0.040%), and New Zealander (3.15, a difference of 0.060%).
| Demographics | Rating | Rank | Average Family Size |
| Immigrants | Bulgaria | 1.0 /100 | #263 | Tragic 3.16 |
| Americans | 1.0 /100 | #264 | Tragic 3.16 |
| Immigrants | South Africa | 0.9 /100 | #265 | Tragic 3.16 |
| Immigrants | Greece | 0.9 /100 | #266 | Tragic 3.16 |
| Iroquois | 0.8 /100 | #267 | Tragic 3.16 |
| Maltese | 0.8 /100 | #268 | Tragic 3.16 |
| Immigrants | Singapore | 0.7 /100 | #269 | Tragic 3.16 |
| Tlingit-Haida | 0.7 /100 | #270 | Tragic 3.16 |
| Immigrants | Germany | 0.7 /100 | #271 | Tragic 3.15 |
| Immigrants | Lithuania | 0.6 /100 | #272 | Tragic 3.15 |
| New Zealanders | 0.6 /100 | #273 | Tragic 3.15 |
| Immigrants | Belgium | 0.6 /100 | #274 | Tragic 3.15 |
| Cambodians | 0.6 /100 | #275 | Tragic 3.15 |
| Immigrants | Bosnia and Herzegovina | 0.5 /100 | #276 | Tragic 3.15 |
| Swiss | 0.5 /100 | #277 | Tragic 3.15 |
Demographics Similar to Immigrants from Uganda by Average Family Size
In terms of average family size, the demographic groups most similar to Immigrants from Uganda are Uruguayan (3.23, a difference of 0.020%), Egyptian (3.23, a difference of 0.030%), Ugandan (3.23, a difference of 0.030%), Immigrants from Senegal (3.23, a difference of 0.050%), and Immigrants from Chile (3.24, a difference of 0.060%).
| Demographics | Rating | Rank | Average Family Size |
| Seminole | 68.2 /100 | #155 | Good 3.24 |
| Immigrants | Taiwan | 68.1 /100 | #156 | Good 3.24 |
| Immigrants | Uzbekistan | 67.0 /100 | #157 | Good 3.24 |
| Iraqis | 64.3 /100 | #158 | Good 3.24 |
| Ethiopians | 63.9 /100 | #159 | Good 3.24 |
| Immigrants | Iraq | 63.7 /100 | #160 | Good 3.24 |
| Immigrants | Chile | 63.2 /100 | #161 | Good 3.24 |
| Immigrants | Uganda | 60.1 /100 | #162 | Good 3.23 |
| Uruguayans | 58.8 /100 | #163 | Average 3.23 |
| Egyptians | 58.6 /100 | #164 | Average 3.23 |
| Ugandans | 58.4 /100 | #165 | Average 3.23 |
| Immigrants | Senegal | 57.5 /100 | #166 | Average 3.23 |
| Dutch West Indians | 56.9 /100 | #167 | Average 3.23 |
| Taiwanese | 54.2 /100 | #168 | Average 3.23 |
| Aleuts | 54.1 /100 | #169 | Average 3.23 |