Tlingit-Haida vs Immigrants from Burma/Myanmar Average Family Size
COMPARE
Tlingit-Haida
Immigrants from Burma/Myanmar
Average Family Size
Average Family Size Comparison
Tlingit-Haida
Immigrants from Burma/Myanmar
3.16
AVERAGE FAMILY SIZE
0.7/ 100
METRIC RATING
270th/ 347
METRIC RANK
3.29
AVERAGE FAMILY SIZE
98.6/ 100
METRIC RATING
101st/ 347
METRIC RANK
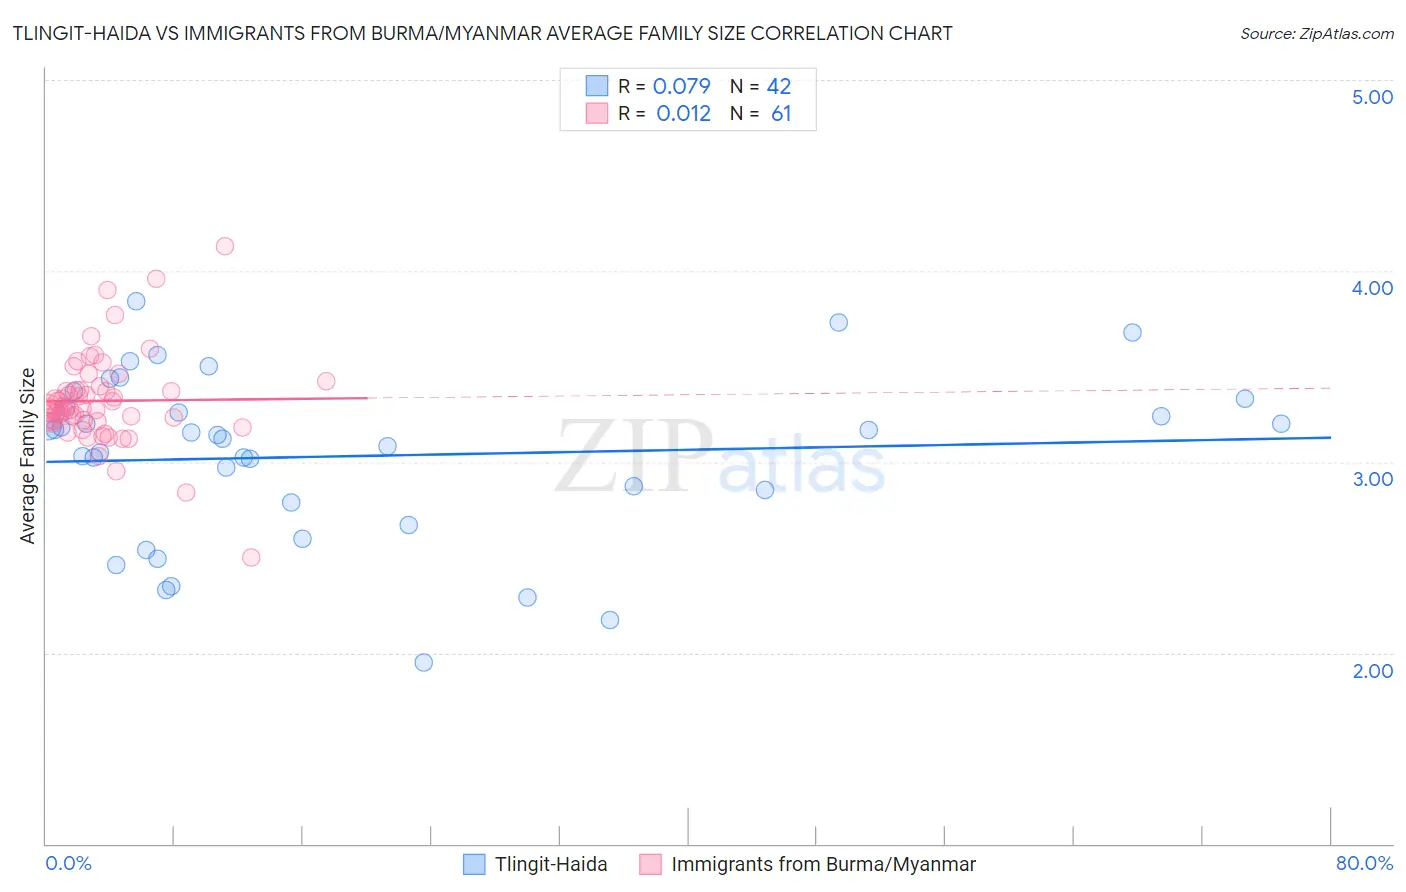
Tlingit-Haida vs Immigrants from Burma/Myanmar Average Family Size Correlation Chart
The statistical analysis conducted on geographies consisting of 60,855,605 people shows a slight positive correlation between the proportion of Tlingit-Haida and average family size in the United States with a correlation coefficient (R) of 0.079 and weighted average of 3.16. Similarly, the statistical analysis conducted on geographies consisting of 172,260,665 people shows no correlation between the proportion of Immigrants from Burma/Myanmar and average family size in the United States with a correlation coefficient (R) of 0.012 and weighted average of 3.29, a difference of 4.3%.
Average Family Size Correlation Summary
| Measurement | Tlingit-Haida | Immigrants from Burma/Myanmar |
| Minimum | 1.95 | 2.50 |
| Maximum | 3.84 | 4.13 |
| Range | 1.89 | 1.63 |
| Mean | 3.03 | 3.32 |
| Median | 3.13 | 3.27 |
| Interquartile 25% (IQ1) | 2.79 | 3.21 |
| Interquartile 75% (IQ3) | 3.29 | 3.39 |
| Interquartile Range (IQR) | 0.50 | 0.17 |
| Standard Deviation (Sample) | 0.44 | 0.25 |
| Standard Deviation (Population) | 0.43 | 0.24 |
Similar Demographics by Average Family Size
Demographics Similar to Tlingit-Haida by Average Family Size
In terms of average family size, the demographic groups most similar to Tlingit-Haida are Immigrants from Germany (3.15, a difference of 0.020%), Immigrants from Singapore (3.16, a difference of 0.030%), Maltese (3.16, a difference of 0.040%), Immigrants from Lithuania (3.15, a difference of 0.040%), and New Zealander (3.15, a difference of 0.060%).
| Demographics | Rating | Rank | Average Family Size |
| Immigrants | Bulgaria | 1.0 /100 | #263 | Tragic 3.16 |
| Americans | 1.0 /100 | #264 | Tragic 3.16 |
| Immigrants | South Africa | 0.9 /100 | #265 | Tragic 3.16 |
| Immigrants | Greece | 0.9 /100 | #266 | Tragic 3.16 |
| Iroquois | 0.8 /100 | #267 | Tragic 3.16 |
| Maltese | 0.8 /100 | #268 | Tragic 3.16 |
| Immigrants | Singapore | 0.7 /100 | #269 | Tragic 3.16 |
| Tlingit-Haida | 0.7 /100 | #270 | Tragic 3.16 |
| Immigrants | Germany | 0.7 /100 | #271 | Tragic 3.15 |
| Immigrants | Lithuania | 0.6 /100 | #272 | Tragic 3.15 |
| New Zealanders | 0.6 /100 | #273 | Tragic 3.15 |
| Immigrants | Belgium | 0.6 /100 | #274 | Tragic 3.15 |
| Cambodians | 0.6 /100 | #275 | Tragic 3.15 |
| Immigrants | Bosnia and Herzegovina | 0.5 /100 | #276 | Tragic 3.15 |
| Swiss | 0.5 /100 | #277 | Tragic 3.15 |
Demographics Similar to Immigrants from Burma/Myanmar by Average Family Size
In terms of average family size, the demographic groups most similar to Immigrants from Burma/Myanmar are West Indian (3.29, a difference of 0.010%), Nigerian (3.29, a difference of 0.020%), Guamanian/Chamorro (3.29, a difference of 0.020%), Immigrants from Oceania (3.29, a difference of 0.030%), and Barbadian (3.29, a difference of 0.030%).
| Demographics | Rating | Rank | Average Family Size |
| Sierra Leoneans | 99.0 /100 | #94 | Exceptional 3.30 |
| Immigrants | Lebanon | 99.0 /100 | #95 | Exceptional 3.30 |
| U.S. Virgin Islanders | 98.8 /100 | #96 | Exceptional 3.29 |
| Immigrants | Oceania | 98.7 /100 | #97 | Exceptional 3.29 |
| Barbadians | 98.6 /100 | #98 | Exceptional 3.29 |
| Nigerians | 98.6 /100 | #99 | Exceptional 3.29 |
| Guamanians/Chamorros | 98.6 /100 | #100 | Exceptional 3.29 |
| Immigrants | Burma/Myanmar | 98.6 /100 | #101 | Exceptional 3.29 |
| West Indians | 98.5 /100 | #102 | Exceptional 3.29 |
| Immigrants | Western Africa | 98.4 /100 | #103 | Exceptional 3.29 |
| Bolivians | 98.3 /100 | #104 | Exceptional 3.29 |
| Immigrants | Ghana | 98.1 /100 | #105 | Exceptional 3.29 |
| Paiute | 98.0 /100 | #106 | Exceptional 3.29 |
| Ghanaians | 98.0 /100 | #107 | Exceptional 3.29 |
| Asians | 97.0 /100 | #108 | Exceptional 3.28 |