Tlingit-Haida vs Immigrants from Turkey Average Family Size
COMPARE
Tlingit-Haida
Immigrants from Turkey
Average Family Size
Average Family Size Comparison
Tlingit-Haida
Immigrants from Turkey
3.16
AVERAGE FAMILY SIZE
0.7/ 100
METRIC RATING
270th/ 347
METRIC RANK
3.18
AVERAGE FAMILY SIZE
4.2/ 100
METRIC RATING
235th/ 347
METRIC RANK
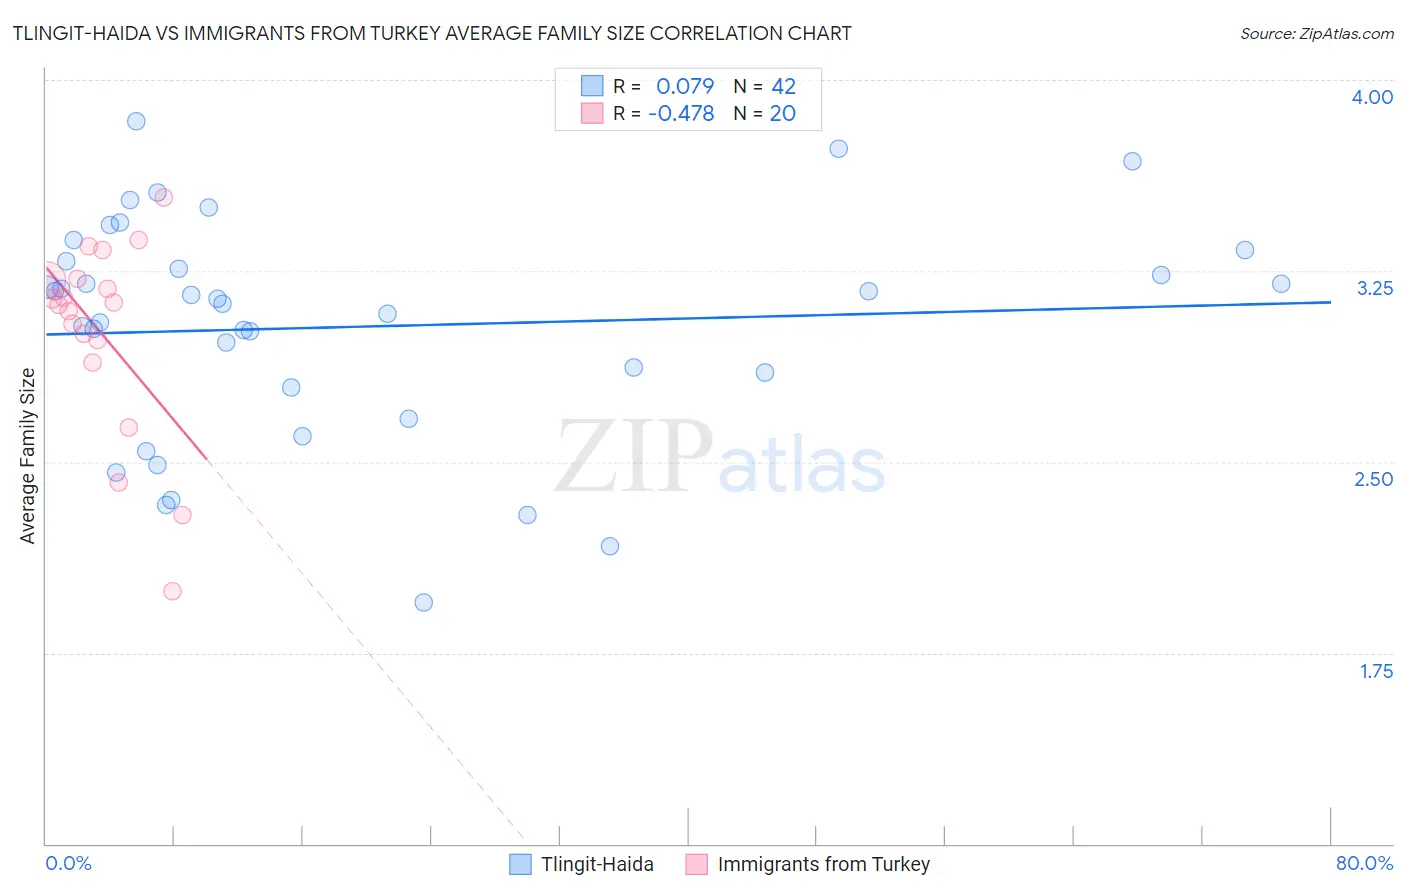
Tlingit-Haida vs Immigrants from Turkey Average Family Size Correlation Chart
The statistical analysis conducted on geographies consisting of 60,855,605 people shows a slight positive correlation between the proportion of Tlingit-Haida and average family size in the United States with a correlation coefficient (R) of 0.079 and weighted average of 3.16. Similarly, the statistical analysis conducted on geographies consisting of 222,976,596 people shows a moderate negative correlation between the proportion of Immigrants from Turkey and average family size in the United States with a correlation coefficient (R) of -0.478 and weighted average of 3.18, a difference of 0.86%.
Average Family Size Correlation Summary
| Measurement | Tlingit-Haida | Immigrants from Turkey |
| Minimum | 1.95 | 1.99 |
| Maximum | 3.84 | 3.54 |
| Range | 1.89 | 1.55 |
| Mean | 3.03 | 3.00 |
| Median | 3.13 | 3.12 |
| Interquartile 25% (IQ1) | 2.79 | 2.93 |
| Interquartile 75% (IQ3) | 3.29 | 3.22 |
| Interquartile Range (IQR) | 0.50 | 0.28 |
| Standard Deviation (Sample) | 0.44 | 0.39 |
| Standard Deviation (Population) | 0.43 | 0.38 |
Similar Demographics by Average Family Size
Demographics Similar to Tlingit-Haida by Average Family Size
In terms of average family size, the demographic groups most similar to Tlingit-Haida are Immigrants from Germany (3.15, a difference of 0.020%), Immigrants from Singapore (3.16, a difference of 0.030%), Maltese (3.16, a difference of 0.040%), Immigrants from Lithuania (3.15, a difference of 0.040%), and New Zealander (3.15, a difference of 0.060%).
| Demographics | Rating | Rank | Average Family Size |
| Immigrants | Bulgaria | 1.0 /100 | #263 | Tragic 3.16 |
| Americans | 1.0 /100 | #264 | Tragic 3.16 |
| Immigrants | South Africa | 0.9 /100 | #265 | Tragic 3.16 |
| Immigrants | Greece | 0.9 /100 | #266 | Tragic 3.16 |
| Iroquois | 0.8 /100 | #267 | Tragic 3.16 |
| Maltese | 0.8 /100 | #268 | Tragic 3.16 |
| Immigrants | Singapore | 0.7 /100 | #269 | Tragic 3.16 |
| Tlingit-Haida | 0.7 /100 | #270 | Tragic 3.16 |
| Immigrants | Germany | 0.7 /100 | #271 | Tragic 3.15 |
| Immigrants | Lithuania | 0.6 /100 | #272 | Tragic 3.15 |
| New Zealanders | 0.6 /100 | #273 | Tragic 3.15 |
| Immigrants | Belgium | 0.6 /100 | #274 | Tragic 3.15 |
| Cambodians | 0.6 /100 | #275 | Tragic 3.15 |
| Immigrants | Bosnia and Herzegovina | 0.5 /100 | #276 | Tragic 3.15 |
| Swiss | 0.5 /100 | #277 | Tragic 3.15 |
Demographics Similar to Immigrants from Turkey by Average Family Size
In terms of average family size, the demographic groups most similar to Immigrants from Turkey are Immigrants from Portugal (3.18, a difference of 0.010%), Iranian (3.18, a difference of 0.020%), Brazilian (3.18, a difference of 0.030%), Cherokee (3.18, a difference of 0.050%), and Immigrants from Romania (3.18, a difference of 0.060%).
| Demographics | Rating | Rank | Average Family Size |
| Immigrants | Nonimmigrants | 5.7 /100 | #228 | Tragic 3.19 |
| Immigrants | Italy | 5.3 /100 | #229 | Tragic 3.19 |
| Icelanders | 5.2 /100 | #230 | Tragic 3.19 |
| Basques | 5.2 /100 | #231 | Tragic 3.19 |
| Cherokee | 4.7 /100 | #232 | Tragic 3.18 |
| Brazilians | 4.5 /100 | #233 | Tragic 3.18 |
| Iranians | 4.5 /100 | #234 | Tragic 3.18 |
| Immigrants | Turkey | 4.2 /100 | #235 | Tragic 3.18 |
| Immigrants | Portugal | 4.2 /100 | #236 | Tragic 3.18 |
| Immigrants | Romania | 3.7 /100 | #237 | Tragic 3.18 |
| Romanians | 3.7 /100 | #238 | Tragic 3.18 |
| Houma | 3.4 /100 | #239 | Tragic 3.18 |
| Osage | 3.2 /100 | #240 | Tragic 3.18 |
| Immigrants | Japan | 3.0 /100 | #241 | Tragic 3.18 |
| Hungarians | 3.0 /100 | #242 | Tragic 3.18 |