Guamanian/Chamorro vs Immigrants from Sweden Single Father Households
COMPARE
Guamanian/Chamorro
Immigrants from Sweden
Single Father Households
Single Father Households Comparison
Guamanians/Chamorros
Immigrants from Sweden
2.6%
SINGLE FATHER HOUSEHOLDS
0.4/ 100
METRIC RATING
267th/ 347
METRIC RANK
2.1%
SINGLE FATHER HOUSEHOLDS
99.8/ 100
METRIC RATING
75th/ 347
METRIC RANK
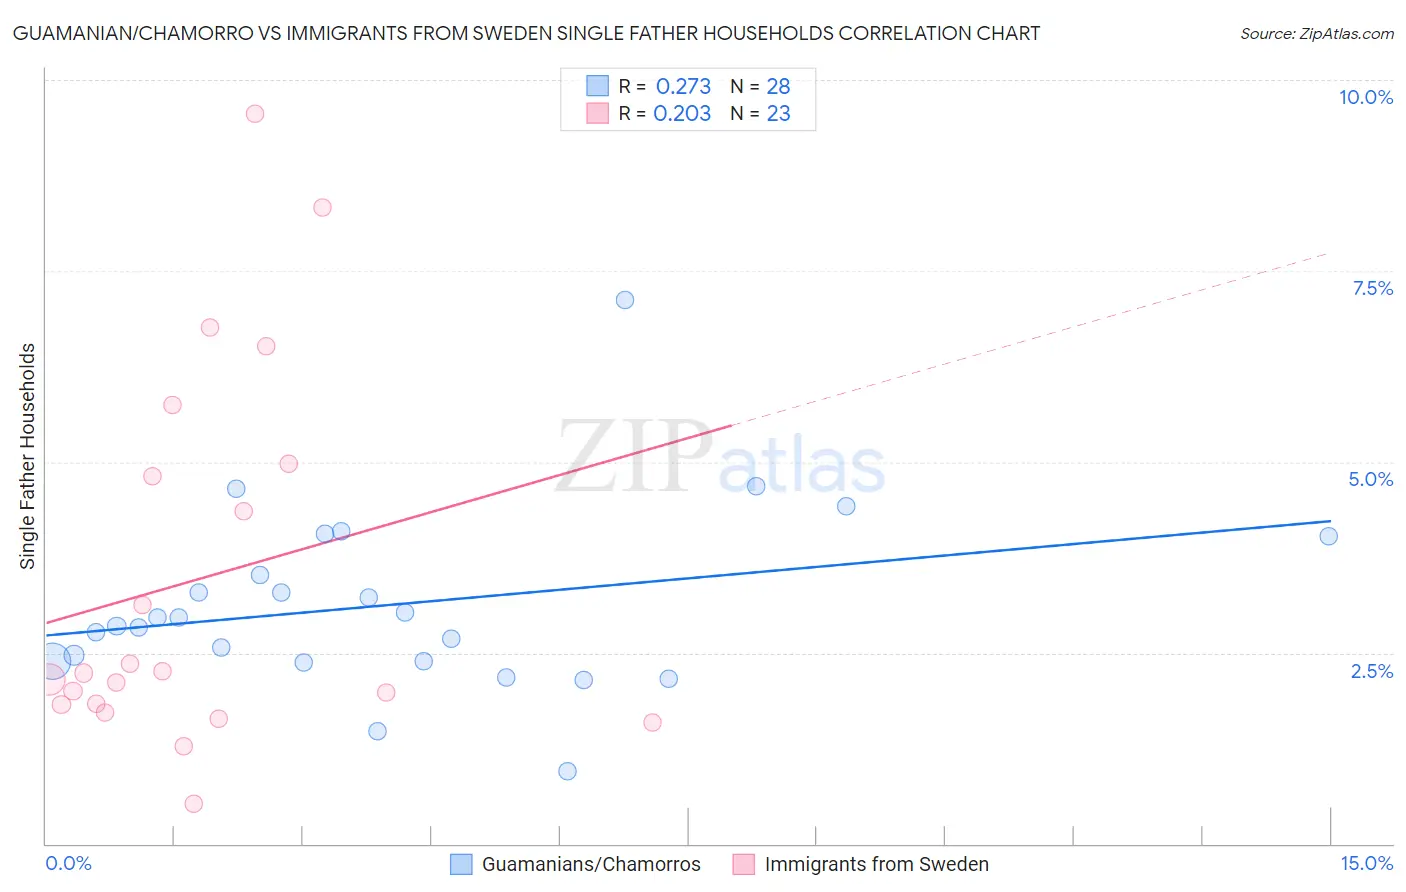
Guamanian/Chamorro vs Immigrants from Sweden Single Father Households Correlation Chart
The statistical analysis conducted on geographies consisting of 221,076,746 people shows a weak positive correlation between the proportion of Guamanians/Chamorros and percentage of single father households in the United States with a correlation coefficient (R) of 0.273 and weighted average of 2.6%. Similarly, the statistical analysis conducted on geographies consisting of 163,814,795 people shows a weak positive correlation between the proportion of Immigrants from Sweden and percentage of single father households in the United States with a correlation coefficient (R) of 0.203 and weighted average of 2.1%, a difference of 24.2%.
Single Father Households Correlation Summary
| Measurement | Guamanian/Chamorro | Immigrants from Sweden |
| Minimum | 0.94% | 0.53% |
| Maximum | 7.1% | 9.6% |
| Range | 6.2% | 9.0% |
| Mean | 3.1% | 3.5% |
| Median | 2.9% | 2.2% |
| Interquartile 25% (IQ1) | 2.4% | 1.8% |
| Interquartile 75% (IQ3) | 3.8% | 5.0% |
| Interquartile Range (IQR) | 1.4% | 3.1% |
| Standard Deviation (Sample) | 1.2% | 2.4% |
| Standard Deviation (Population) | 1.2% | 2.4% |
Similar Demographics by Single Father Households
Demographics Similar to Guamanians/Chamorros by Single Father Households
In terms of single father households, the demographic groups most similar to Guamanians/Chamorros are Haitian (2.6%, a difference of 0.040%), Cuban (2.6%, a difference of 0.38%), French American Indian (2.6%, a difference of 0.48%), Immigrants from Micronesia (2.6%, a difference of 0.52%), and Seminole (2.6%, a difference of 0.52%).
| Demographics | Rating | Rank | Single Father Households |
| Immigrants | Caribbean | 1.0 /100 | #260 | Tragic 2.5% |
| Immigrants | Belize | 0.9 /100 | #261 | Tragic 2.5% |
| Immigrants | Liberia | 0.8 /100 | #262 | Tragic 2.5% |
| Dominicans | 0.8 /100 | #263 | Tragic 2.5% |
| Indonesians | 0.5 /100 | #264 | Tragic 2.6% |
| Immigrants | Micronesia | 0.5 /100 | #265 | Tragic 2.6% |
| French American Indians | 0.5 /100 | #266 | Tragic 2.6% |
| Guamanians/Chamorros | 0.4 /100 | #267 | Tragic 2.6% |
| Haitians | 0.4 /100 | #268 | Tragic 2.6% |
| Cubans | 0.3 /100 | #269 | Tragic 2.6% |
| Seminole | 0.3 /100 | #270 | Tragic 2.6% |
| Creek | 0.2 /100 | #271 | Tragic 2.6% |
| Belizeans | 0.2 /100 | #272 | Tragic 2.6% |
| Iroquois | 0.2 /100 | #273 | Tragic 2.6% |
| Puerto Ricans | 0.2 /100 | #274 | Tragic 2.6% |
Demographics Similar to Immigrants from Sweden by Single Father Households
In terms of single father households, the demographic groups most similar to Immigrants from Sweden are Immigrants from Scotland (2.1%, a difference of 0.010%), Immigrants from Saudi Arabia (2.1%, a difference of 0.040%), Immigrants from Egypt (2.1%, a difference of 0.28%), Immigrants from Bangladesh (2.1%, a difference of 0.29%), and Estonian (2.1%, a difference of 0.35%).
| Demographics | Rating | Rank | Single Father Households |
| Immigrants | Denmark | 99.8 /100 | #68 | Exceptional 2.1% |
| Immigrants | Romania | 99.8 /100 | #69 | Exceptional 2.1% |
| Egyptians | 99.8 /100 | #70 | Exceptional 2.1% |
| Immigrants | Kuwait | 99.8 /100 | #71 | Exceptional 2.1% |
| Immigrants | Spain | 99.8 /100 | #72 | Exceptional 2.1% |
| Immigrants | Bangladesh | 99.8 /100 | #73 | Exceptional 2.1% |
| Immigrants | Egypt | 99.8 /100 | #74 | Exceptional 2.1% |
| Immigrants | Sweden | 99.8 /100 | #75 | Exceptional 2.1% |
| Immigrants | Scotland | 99.8 /100 | #76 | Exceptional 2.1% |
| Immigrants | Saudi Arabia | 99.8 /100 | #77 | Exceptional 2.1% |
| Estonians | 99.7 /100 | #78 | Exceptional 2.1% |
| Immigrants | Asia | 99.7 /100 | #79 | Exceptional 2.1% |
| Immigrants | South Africa | 99.7 /100 | #80 | Exceptional 2.1% |
| Armenians | 99.7 /100 | #81 | Exceptional 2.1% |
| New Zealanders | 99.7 /100 | #82 | Exceptional 2.1% |