Guamanian/Chamorro vs Immigrants from Oceania Single Father Households
COMPARE
Guamanian/Chamorro
Immigrants from Oceania
Single Father Households
Single Father Households Comparison
Guamanians/Chamorros
Immigrants from Oceania
2.6%
SINGLE FATHER HOUSEHOLDS
0.4/ 100
METRIC RATING
267th/ 347
METRIC RANK
2.5%
SINGLE FATHER HOUSEHOLDS
5.8/ 100
METRIC RATING
239th/ 347
METRIC RANK
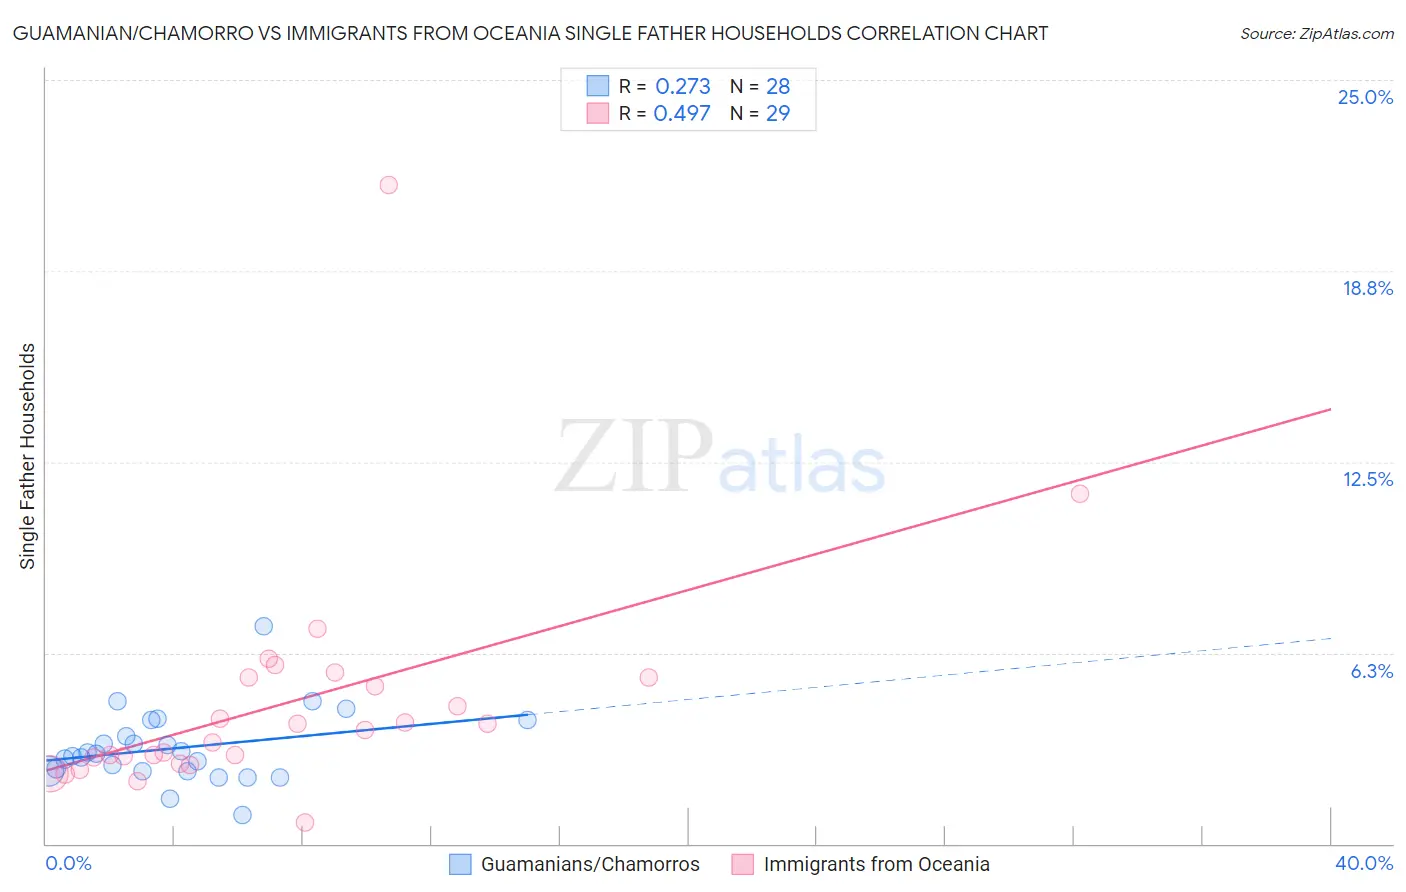
Guamanian/Chamorro vs Immigrants from Oceania Single Father Households Correlation Chart
The statistical analysis conducted on geographies consisting of 221,076,746 people shows a weak positive correlation between the proportion of Guamanians/Chamorros and percentage of single father households in the United States with a correlation coefficient (R) of 0.273 and weighted average of 2.6%. Similarly, the statistical analysis conducted on geographies consisting of 303,379,404 people shows a moderate positive correlation between the proportion of Immigrants from Oceania and percentage of single father households in the United States with a correlation coefficient (R) of 0.497 and weighted average of 2.5%, a difference of 5.0%.
Single Father Households Correlation Summary
| Measurement | Guamanian/Chamorro | Immigrants from Oceania |
| Minimum | 0.94% | 0.70% |
| Maximum | 7.1% | 21.5% |
| Range | 6.2% | 20.8% |
| Mean | 3.1% | 4.6% |
| Median | 2.9% | 3.7% |
| Interquartile 25% (IQ1) | 2.4% | 2.7% |
| Interquartile 75% (IQ3) | 3.8% | 5.4% |
| Interquartile Range (IQR) | 1.4% | 2.7% |
| Standard Deviation (Sample) | 1.2% | 3.8% |
| Standard Deviation (Population) | 1.2% | 3.8% |
Similar Demographics by Single Father Households
Demographics Similar to Guamanians/Chamorros by Single Father Households
In terms of single father households, the demographic groups most similar to Guamanians/Chamorros are Haitian (2.6%, a difference of 0.040%), Cuban (2.6%, a difference of 0.38%), French American Indian (2.6%, a difference of 0.48%), Immigrants from Micronesia (2.6%, a difference of 0.52%), and Seminole (2.6%, a difference of 0.52%).
| Demographics | Rating | Rank | Single Father Households |
| Immigrants | Caribbean | 1.0 /100 | #260 | Tragic 2.5% |
| Immigrants | Belize | 0.9 /100 | #261 | Tragic 2.5% |
| Immigrants | Liberia | 0.8 /100 | #262 | Tragic 2.5% |
| Dominicans | 0.8 /100 | #263 | Tragic 2.5% |
| Indonesians | 0.5 /100 | #264 | Tragic 2.6% |
| Immigrants | Micronesia | 0.5 /100 | #265 | Tragic 2.6% |
| French American Indians | 0.5 /100 | #266 | Tragic 2.6% |
| Guamanians/Chamorros | 0.4 /100 | #267 | Tragic 2.6% |
| Haitians | 0.4 /100 | #268 | Tragic 2.6% |
| Cubans | 0.3 /100 | #269 | Tragic 2.6% |
| Seminole | 0.3 /100 | #270 | Tragic 2.6% |
| Creek | 0.2 /100 | #271 | Tragic 2.6% |
| Belizeans | 0.2 /100 | #272 | Tragic 2.6% |
| Iroquois | 0.2 /100 | #273 | Tragic 2.6% |
| Puerto Ricans | 0.2 /100 | #274 | Tragic 2.6% |
Demographics Similar to Immigrants from Oceania by Single Father Households
In terms of single father households, the demographic groups most similar to Immigrants from Oceania are Immigrants from Sierra Leone (2.5%, a difference of 0.010%), Sierra Leonean (2.5%, a difference of 0.040%), Cajun (2.5%, a difference of 0.090%), Immigrants (2.5%, a difference of 0.14%), and African (2.5%, a difference of 0.16%).
| Demographics | Rating | Rank | Single Father Households |
| Pennsylvania Germans | 7.3 /100 | #232 | Tragic 2.4% |
| Immigrants | Western Africa | 7.0 /100 | #233 | Tragic 2.4% |
| Africans | 6.3 /100 | #234 | Tragic 2.5% |
| Immigrants | Immigrants | 6.3 /100 | #235 | Tragic 2.5% |
| Cajuns | 6.1 /100 | #236 | Tragic 2.5% |
| Sierra Leoneans | 5.9 /100 | #237 | Tragic 2.5% |
| Immigrants | Sierra Leone | 5.8 /100 | #238 | Tragic 2.5% |
| Immigrants | Oceania | 5.8 /100 | #239 | Tragic 2.5% |
| Immigrants | Dominica | 4.8 /100 | #240 | Tragic 2.5% |
| Portuguese | 4.1 /100 | #241 | Tragic 2.5% |
| Osage | 4.1 /100 | #242 | Tragic 2.5% |
| Spaniards | 3.1 /100 | #243 | Tragic 2.5% |
| Immigrants | Middle Africa | 2.8 /100 | #244 | Tragic 2.5% |
| Basques | 2.5 /100 | #245 | Tragic 2.5% |
| Native Hawaiians | 2.5 /100 | #246 | Tragic 2.5% |