Black/African American vs Ugandan Births to Unmarried Women

COMPARE

Black/African American
Race
Ancestry
AfghanAfricanAlaska NativeAlaskan AthabascanAlbanianAleutAlsatianAmericanApacheArabArapahoArgentineanArmenianAssyrian/Chaldean/SyriacAustralianAustrianBahamianBangladeshiBarbadianBasqueBelgianBelizeanBermudanBhutaneseBlackfeetBolivianBrazilianBritishBritish West IndianBulgarianBurmeseCajunCambodianCanadianCape VerdeanCarpatho RusynCelticCentral AmericanCentral American IndianCherokeeCheyenneChickasawChileanChineseChippewaChoctawColombianColvilleComancheCosta RicanCreeCreekCroatianCrowCubanCypriotCzechCzechoslovakianDanishDelawareDominicanDutchDutch West IndianEastern EuropeanEcuadorianEgyptianEnglishEstonianEthiopianEuropeanFijianFilipinoFinnishFrenchFrench American IndianFrench CanadianGermanGerman RussianGhanaianGreekGuamanian/ChamorroGuatemalanGuyaneseHaitianHmongHonduranHopiHoumaHungarianIcelanderIndian (Asian)IndonesianInupiatIranianIraqiIrishIroquoisIsraeliItalianJamaicanJapaneseJordanianKenyanKiowaKoreanLaotianLatvianLebaneseLiberianLithuanianLumbeeLuxembourgerMacedonianMalaysianMalteseMarshalleseMenomineeMexicanMexican American IndianMongolianMoroccanNative HawaiianNavajoNepaleseNew ZealanderNicaraguanNigerianNorthern EuropeanNorwegianOkinawanOsageOttawaPaiutePakistaniPalestinianPanamanianParaguayanPennsylvania GermanPeruvianPimaPolishPortuguesePotawatomiPuebloPuerto RicanPuget Sound SalishRomanianRussianSalvadoranSamoanScandinavianScotch-IrishScottishSeminoleSenegaleseSerbianShoshoneSierra LeoneanSiouxSlavicSlovakSloveneSomaliSouth AfricanSouth AmericanSouth American IndianSoviet UnionSpaniardSpanishSpanish AmericanSpanish American IndianSri LankanSubsaharan AfricanSudaneseSwedishSwissSyrianTaiwaneseThaiTlingit-HaidaTohono O'OdhamTonganTrinidadian and TobagonianTsimshianTurkishU.S. Virgin IslanderUkrainianUruguayanUteVenezuelanVietnameseWelshWest IndianYakamaYaquiYugoslavianYumanYup'ikZimbabwean
Immigration
NonimmigrantsImmigrantsAfghanistanAfricaAlbaniaArgentinaArmeniaAsiaAustraliaAustriaBahamasBangladeshBarbadosBelarusBelgiumBelizeBoliviaBosnia and HerzegovinaBrazilBulgariaBurma/MyanmarCabo VerdeCambodiaCameroonCanadaCaribbeanCentral AmericaChileChinaColombiaCongoCosta RicaCroatiaCubaCzechoslovakiaDenmarkDominicaDominican RepublicEastern AfricaEastern AsiaEastern EuropeEcuadorEgyptEl SalvadorEnglandEritreaEthiopiaEuropeFijiFranceGermanyGhanaGreeceGrenadaGuatemalaGuyanaHaitiHondurasHong KongHungaryIndiaIndonesiaIranIraqIrelandIsraelItalyJamaicaJapanJordanKazakhstanKenyaKoreaKuwaitLaosLatin AmericaLatviaLebanonLiberiaLithuaniaMalaysiaMexicoMicronesiaMiddle AfricaMoldovaMoroccoNepalNetherlandsNicaraguaNigeriaNorth AmericaNorth MacedoniaNorthern AfricaNorthern EuropeNorwayOceaniaPakistanPanamaPeruPhilippinesPolandPortugalRomaniaRussiaSaudi ArabiaScotlandSenegalSerbiaSierra LeoneSingaporeSomaliaSouth AfricaSouth AmericaSouth Central AsiaSouth Eastern AsiaSouthern EuropeSpainSri LankaSt. Vincent and the GrenadinesSudanSwedenSwitzerlandSyriaTaiwanThailandTrinidad and TobagoTurkeyUgandaUkraineUruguayUzbekistanVenezuelaVietnamWest IndiesWestern AfricaWestern AsiaWestern EuropeYemenZaireZimbabweAzores
Ugandan
Race
Ancestry
AfghanAfricanAlaska NativeAlaskan AthabascanAlbanianAleutAlsatianAmericanApacheArabArapahoArgentineanArmenianAssyrian/Chaldean/SyriacAustralianAustrianBahamianBangladeshiBarbadianBasqueBelgianBelizeanBermudanBhutaneseBlackfeetBolivianBrazilianBritishBritish West IndianBulgarianBurmeseCajunCambodianCanadianCape VerdeanCarpatho RusynCelticCentral AmericanCentral American IndianCherokeeCheyenneChickasawChileanChineseChippewaChoctawColombianColvilleComancheCosta RicanCreeCreekCroatianCrowCubanCypriotCzechCzechoslovakianDanishDelawareDominicanDutchDutch West IndianEastern EuropeanEcuadorianEgyptianEnglishEstonianEthiopianEuropeanFijianFilipinoFinnishFrenchFrench American IndianFrench CanadianGermanGerman RussianGhanaianGreekGuamanian/ChamorroGuatemalanGuyaneseHaitianHmongHonduranHopiHoumaHungarianIcelanderIndian (Asian)IndonesianInupiatIranianIraqiIrishIroquoisIsraeliItalianJamaicanJapaneseJordanianKenyanKiowaKoreanLaotianLatvianLebaneseLiberianLithuanianLumbeeLuxembourgerMacedonianMalaysianMalteseMarshalleseMenomineeMexicanMexican American IndianMongolianMoroccanNative HawaiianNavajoNepaleseNew ZealanderNicaraguanNigerianNorthern EuropeanNorwegianOkinawanOsageOttawaPaiutePakistaniPalestinianPanamanianParaguayanPennsylvania GermanPeruvianPimaPolishPortuguesePotawatomiPuebloPuerto RicanPuget Sound SalishRomanianRussianSalvadoranSamoanScandinavianScotch-IrishScottishSeminoleSenegaleseSerbianShoshoneSierra LeoneanSiouxSlavicSlovakSloveneSomaliSouth AfricanSouth AmericanSouth American IndianSoviet UnionSpaniardSpanishSpanish AmericanSpanish American IndianSri LankanSubsaharan AfricanSudaneseSwedishSwissSyrianTaiwaneseThaiTlingit-HaidaTohono O'OdhamTonganTrinidadian and TobagonianTsimshianTurkishU.S. Virgin IslanderUgandanUkrainianUruguayanUteVenezuelanVietnameseWelshWest IndianYakamaYaquiYugoslavianYumanYup'ikZimbabwean
Immigration
NonimmigrantsImmigrantsAfghanistanAfricaAlbaniaArgentinaArmeniaAsiaAustraliaAustriaBahamasBangladeshBarbadosBelarusBelgiumBelizeBoliviaBosnia and HerzegovinaBrazilBulgariaBurma/MyanmarCabo VerdeCambodiaCameroonCanadaCaribbeanCentral AmericaChileChinaColombiaCongoCosta RicaCroatiaCubaCzechoslovakiaDenmarkDominicaDominican RepublicEastern AfricaEastern AsiaEastern EuropeEcuadorEgyptEl SalvadorEnglandEritreaEthiopiaEuropeFijiFranceGermanyGhanaGreeceGrenadaGuatemalaGuyanaHaitiHondurasHong KongHungaryIndiaIndonesiaIranIraqIrelandIsraelItalyJamaicaJapanJordanKazakhstanKenyaKoreaKuwaitLaosLatin AmericaLatviaLebanonLiberiaLithuaniaMalaysiaMexicoMicronesiaMiddle AfricaMoldovaMoroccoNepalNetherlandsNicaraguaNigeriaNorth AmericaNorth MacedoniaNorthern AfricaNorthern EuropeNorwayOceaniaPakistanPanamaPeruPhilippinesPolandPortugalRomaniaRussiaSaudi ArabiaScotlandSenegalSerbiaSierra LeoneSingaporeSomaliaSouth AfricaSouth AmericaSouth Central AsiaSouth Eastern AsiaSouthern EuropeSpainSri LankaSt. Vincent and the GrenadinesSudanSwedenSwitzerlandSyriaTaiwanThailandTrinidad and TobagoTurkeyUgandaUkraineUruguayUzbekistanVenezuelaVietnamWest IndiesWestern AfricaWestern AsiaWestern EuropeYemenZaireZimbabweAzores
Births to Unmarried Women
Income
Poverty
Unemployment
Labor Participation
Family Structure
Vehicle Availability
Education Level
Disability

Births to Unmarried Women Comparison

Blacks/African Americans

Ugandans

Tragic
Excellent
44.3%
BIRTHS TO UNMARRIED WOMEN
0.0/ 100
METRIC RATING
333rd/ 347
METRIC RANK
30.1%
BIRTHS TO UNMARRIED WOMEN
89.2/ 100
METRIC RATING
120th/ 347
METRIC RANK

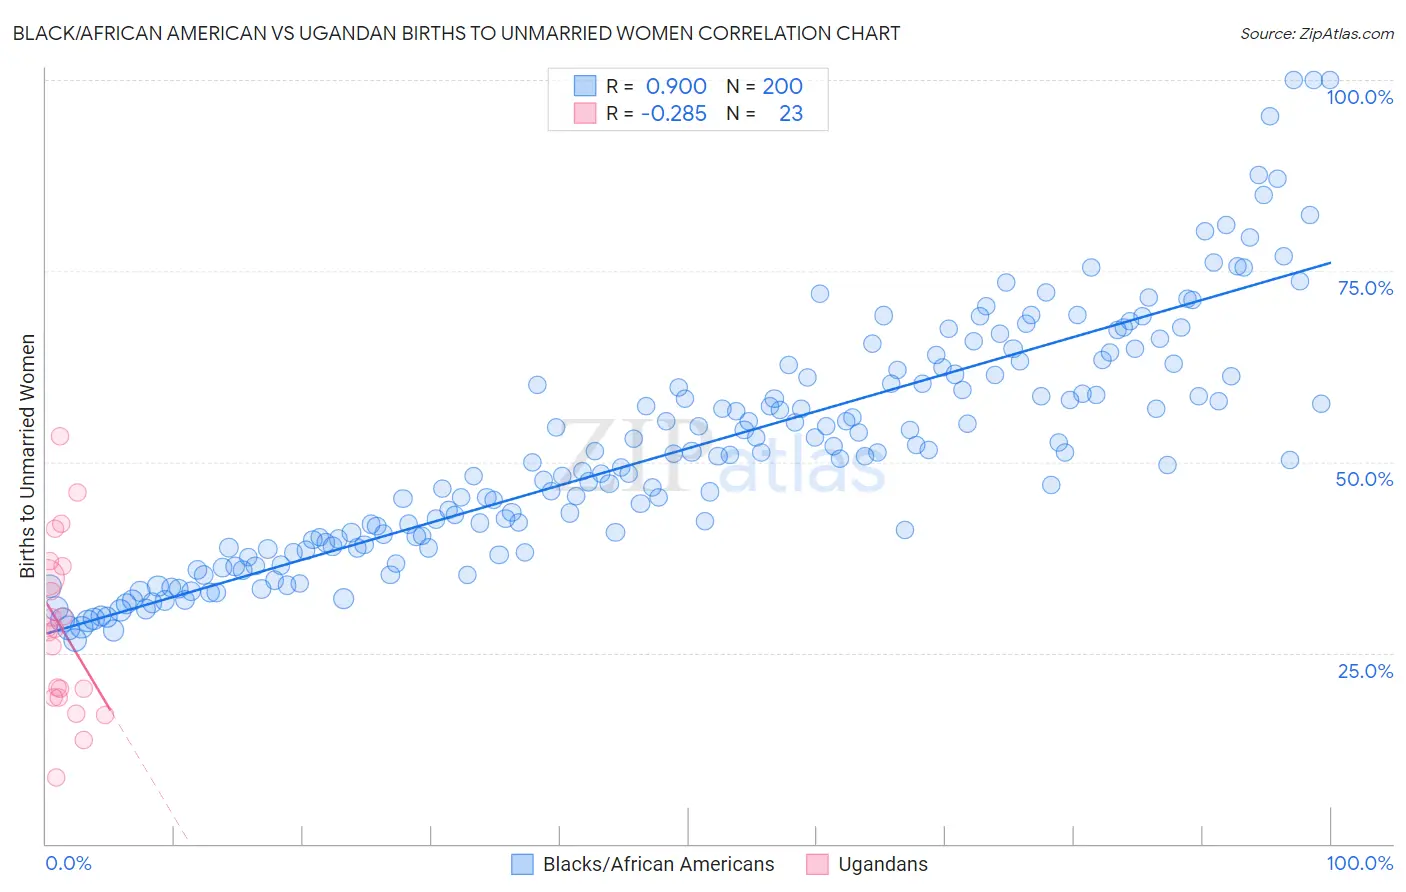
Black/African American vs Ugandan Births to Unmarried Women Correlation Chart

The statistical analysis conducted on geographies consisting of 506,152,506 people shows a very strong positive correlation between the proportion of Blacks/African Americans and percentage of births to unmarried women in the United States with a correlation coefficient (R) of 0.900 and weighted average of 44.3%. Similarly, the statistical analysis conducted on geographies consisting of 92,593,945 people shows a weak negative correlation between the proportion of Ugandans and percentage of births to unmarried women in the United States with a correlation coefficient (R) of -0.285 and weighted average of 30.1%, a difference of 47.2%.
Black/African American vs Ugandan Births to Unmarried Women

Births to Unmarried Women Correlation Summary

MeasurementBlack/African AmericanUgandan
Minimum26.7%8.7%
Maximum100.0%53.4%
Range73.3%44.7%
Mean51.8%28.2%
Median50.9%28.1%
Interquartile 25% (IQ1)39.1%19.1%
Interquartile 75% (IQ3)61.4%36.4%
Interquartile Range (IQR)22.4%17.3%
Standard Deviation (Sample)15.6%11.1%
Standard Deviation (Population)15.6%10.9%

Similar Demographics by Births to Unmarried Women

Demographics Similar to Blacks/African Americans by Births to Unmarried Women

In terms of births to unmarried women, the demographic groups most similar to Blacks/African Americans are Yuman (44.4%, a difference of 0.17%), Colville (45.3%, a difference of 2.3%), Kiowa (43.1%, a difference of 2.7%), Native/Alaskan (43.0%, a difference of 3.0%), and Puerto Rican (45.7%, a difference of 3.1%).
DemographicsRating | RankBirths to Unmarried Women
Immigrants | Cuba
0.0
/100
|
#326
Tragic
41.5%
Tsimshian
0.0
/100
|
#327
Tragic
42.2%
Immigrants | Cabo Verde
0.0
/100
|
#328
Tragic
42.2%
Paiute
0.0
/100
|
#329
Tragic
42.5%
Chippewa
0.0
/100
|
#330
Tragic
42.6%
Natives/Alaskans
0.0
/100
|
#331
Tragic
43.0%
Kiowa
0.0
/100
|
#332
Tragic
43.1%
Blacks/African Americans
0.0
/100
|
#333
Tragic
44.3%
Yuman
0.0
/100
|
#334
Tragic
44.4%
Colville
0.0
/100
|
#335
Tragic
45.3%
Puerto Ricans
0.0
/100
|
#336
Tragic
45.7%
Houma
0.0
/100
|
#337
Tragic
46.6%
Arapaho
0.0
/100
|
#338
Tragic
47.1%
Lumbee
0.0
/100
|
#339
Tragic
48.2%
Tohono O'odham
0.0
/100
|
#340
Tragic
49.8%

Demographics Similar to Ugandans by Births to Unmarried Women

In terms of births to unmarried women, the demographic groups most similar to Ugandans are Korean (30.1%, a difference of 0.070%), Immigrants from Argentina (30.1%, a difference of 0.12%), Syrian (30.2%, a difference of 0.25%), Croatian (30.2%, a difference of 0.29%), and Argentinean (30.0%, a difference of 0.36%).
DemographicsRating | RankBirths to Unmarried Women
Scandinavians
92.7
/100
|
#113
Exceptional
29.8%
Immigrants | Croatia
92.6
/100
|
#114
Exceptional
29.8%
Ethiopians
91.9
/100
|
#115
Exceptional
29.8%
Immigrants | Italy
91.7
/100
|
#116
Exceptional
29.9%
Immigrants | Netherlands
91.1
/100
|
#117
Exceptional
29.9%
Immigrants | Norway
91.0
/100
|
#118
Exceptional
29.9%
Argentineans
90.5
/100
|
#119
Exceptional
30.0%
Ugandans
89.2
/100
|
#120
Excellent
30.1%
Koreans
88.9
/100
|
#121
Excellent
30.1%
Immigrants | Argentina
88.7
/100
|
#122
Excellent
30.1%
Syrians
88.2
/100
|
#123
Excellent
30.2%
Croatians
88.0
/100
|
#124
Excellent
30.2%
Vietnamese
87.7
/100
|
#125
Excellent
30.2%
Europeans
87.2
/100
|
#126
Excellent
30.2%
Chinese
87.1
/100
|
#127
Excellent
30.2%