Black/African American vs Immigrants from Liberia Births to Unmarried Women
COMPARE
Black/African American
Immigrants from Liberia
Births to Unmarried Women
Births to Unmarried Women Comparison
Blacks/African Americans
Immigrants from Liberia
44.3%
BIRTHS TO UNMARRIED WOMEN
0.0/ 100
METRIC RATING
333rd/ 347
METRIC RANK
37.6%
BIRTHS TO UNMARRIED WOMEN
0.0/ 100
METRIC RATING
288th/ 347
METRIC RANK
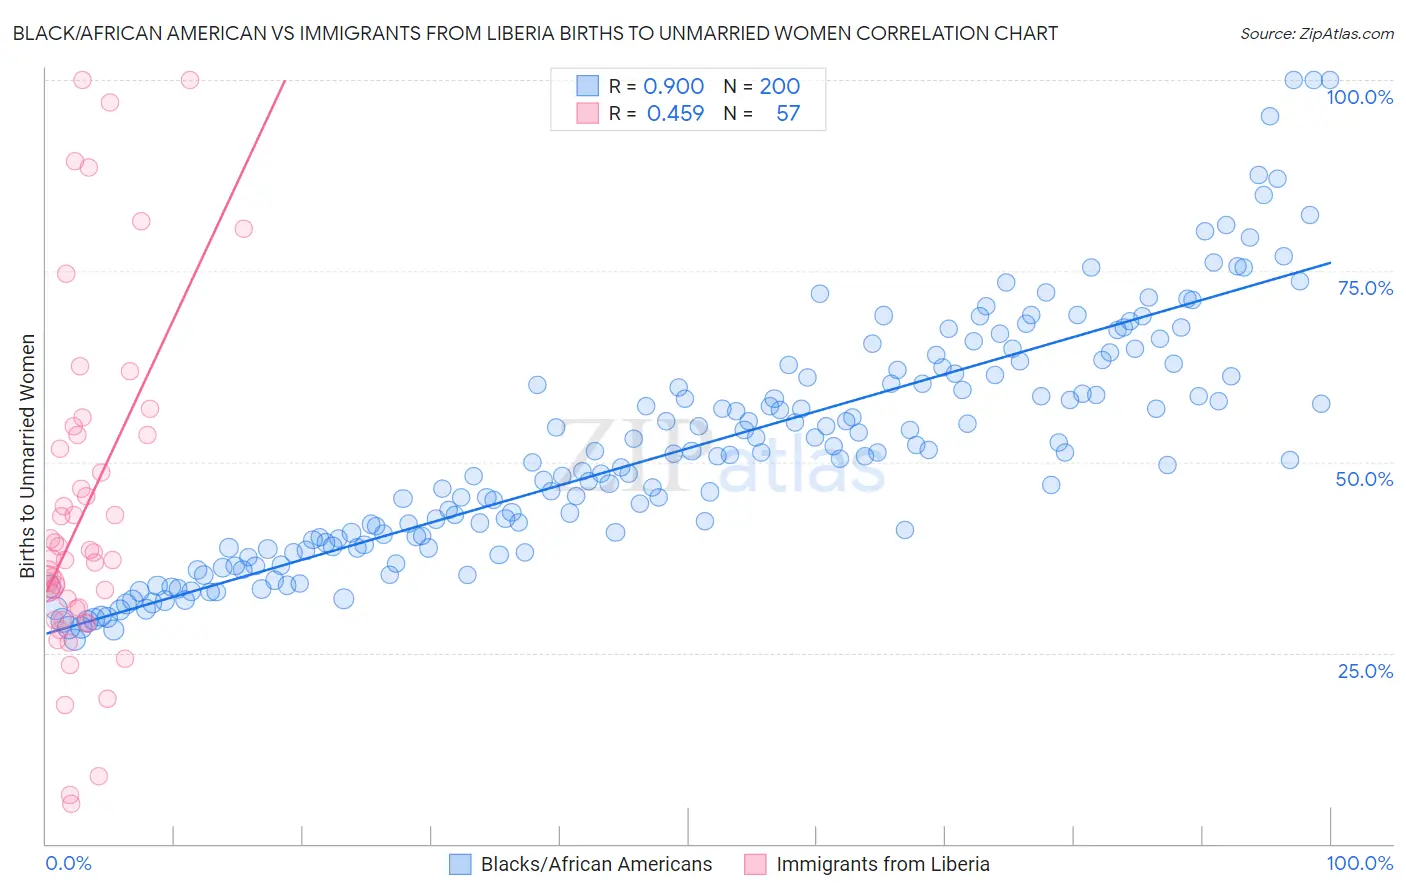
Black/African American vs Immigrants from Liberia Births to Unmarried Women Correlation Chart
The statistical analysis conducted on geographies consisting of 506,152,506 people shows a very strong positive correlation between the proportion of Blacks/African Americans and percentage of births to unmarried women in the United States with a correlation coefficient (R) of 0.900 and weighted average of 44.3%. Similarly, the statistical analysis conducted on geographies consisting of 132,597,891 people shows a moderate positive correlation between the proportion of Immigrants from Liberia and percentage of births to unmarried women in the United States with a correlation coefficient (R) of 0.459 and weighted average of 37.6%, a difference of 17.7%.
Births to Unmarried Women Correlation Summary
| Measurement | Black/African American | Immigrants from Liberia |
| Minimum | 26.7% | 5.3% |
| Maximum | 100.0% | 100.0% |
| Range | 73.3% | 94.7% |
| Mean | 51.8% | 43.7% |
| Median | 50.9% | 37.4% |
| Interquartile 25% (IQ1) | 39.1% | 30.1% |
| Interquartile 75% (IQ3) | 61.4% | 53.5% |
| Interquartile Range (IQR) | 22.4% | 23.4% |
| Standard Deviation (Sample) | 15.6% | 22.3% |
| Standard Deviation (Population) | 15.6% | 22.1% |
Similar Demographics by Births to Unmarried Women
Demographics Similar to Blacks/African Americans by Births to Unmarried Women
In terms of births to unmarried women, the demographic groups most similar to Blacks/African Americans are Yuman (44.4%, a difference of 0.17%), Colville (45.3%, a difference of 2.3%), Kiowa (43.1%, a difference of 2.7%), Native/Alaskan (43.0%, a difference of 3.0%), and Puerto Rican (45.7%, a difference of 3.1%).
| Demographics | Rating | Rank | Births to Unmarried Women |
| Immigrants | Cuba | 0.0 /100 | #326 | Tragic 41.5% |
| Tsimshian | 0.0 /100 | #327 | Tragic 42.2% |
| Immigrants | Cabo Verde | 0.0 /100 | #328 | Tragic 42.2% |
| Paiute | 0.0 /100 | #329 | Tragic 42.5% |
| Chippewa | 0.0 /100 | #330 | Tragic 42.6% |
| Natives/Alaskans | 0.0 /100 | #331 | Tragic 43.0% |
| Kiowa | 0.0 /100 | #332 | Tragic 43.1% |
| Blacks/African Americans | 0.0 /100 | #333 | Tragic 44.3% |
| Yuman | 0.0 /100 | #334 | Tragic 44.4% |
| Colville | 0.0 /100 | #335 | Tragic 45.3% |
| Puerto Ricans | 0.0 /100 | #336 | Tragic 45.7% |
| Houma | 0.0 /100 | #337 | Tragic 46.6% |
| Arapaho | 0.0 /100 | #338 | Tragic 47.1% |
| Lumbee | 0.0 /100 | #339 | Tragic 48.2% |
| Tohono O'odham | 0.0 /100 | #340 | Tragic 49.8% |
Demographics Similar to Immigrants from Liberia by Births to Unmarried Women
In terms of births to unmarried women, the demographic groups most similar to Immigrants from Liberia are Creek (37.6%, a difference of 0.17%), Alaskan Athabascan (37.7%, a difference of 0.23%), Hispanic or Latino (37.8%, a difference of 0.37%), Immigrants from Guatemala (37.5%, a difference of 0.40%), and Immigrants from Mexico (37.5%, a difference of 0.41%).
| Demographics | Rating | Rank | Births to Unmarried Women |
| Immigrants | Belize | 0.1 /100 | #281 | Tragic 37.3% |
| Liberians | 0.0 /100 | #282 | Tragic 37.4% |
| Spanish American Indians | 0.0 /100 | #283 | Tragic 37.4% |
| Immigrants | Central America | 0.0 /100 | #284 | Tragic 37.4% |
| Immigrants | Mexico | 0.0 /100 | #285 | Tragic 37.5% |
| Immigrants | Guatemala | 0.0 /100 | #286 | Tragic 37.5% |
| Creek | 0.0 /100 | #287 | Tragic 37.6% |
| Immigrants | Liberia | 0.0 /100 | #288 | Tragic 37.6% |
| Alaskan Athabascans | 0.0 /100 | #289 | Tragic 37.7% |
| Hispanics or Latinos | 0.0 /100 | #290 | Tragic 37.8% |
| Seminole | 0.0 /100 | #291 | Tragic 37.9% |
| Blackfeet | 0.0 /100 | #292 | Tragic 37.9% |
| Immigrants | Nicaragua | 0.0 /100 | #293 | Tragic 38.0% |
| British West Indians | 0.0 /100 | #294 | Tragic 38.0% |
| Iroquois | 0.0 /100 | #295 | Tragic 38.2% |