Black/African American vs Sudanese Births to Unmarried Women
COMPARE
Black/African American
Sudanese
Births to Unmarried Women
Births to Unmarried Women Comparison
Blacks/African Americans
Sudanese
44.3%
BIRTHS TO UNMARRIED WOMEN
0.0/ 100
METRIC RATING
333rd/ 347
METRIC RANK
32.4%
BIRTHS TO UNMARRIED WOMEN
27.3/ 100
METRIC RATING
194th/ 347
METRIC RANK
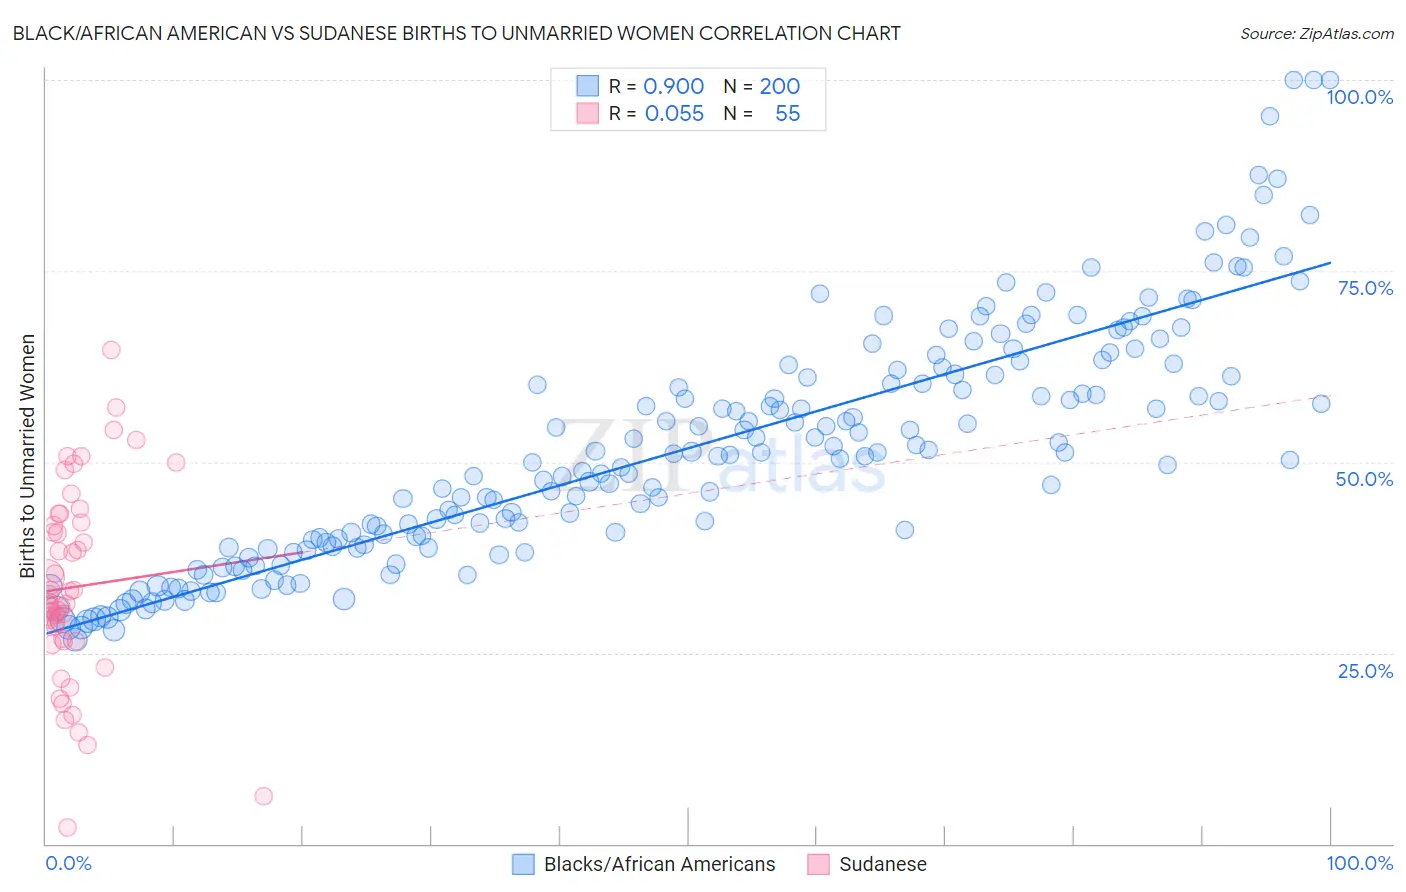
Black/African American vs Sudanese Births to Unmarried Women Correlation Chart
The statistical analysis conducted on geographies consisting of 506,152,506 people shows a very strong positive correlation between the proportion of Blacks/African Americans and percentage of births to unmarried women in the United States with a correlation coefficient (R) of 0.900 and weighted average of 44.3%. Similarly, the statistical analysis conducted on geographies consisting of 107,881,308 people shows a slight positive correlation between the proportion of Sudanese and percentage of births to unmarried women in the United States with a correlation coefficient (R) of 0.055 and weighted average of 32.4%, a difference of 36.7%.
Births to Unmarried Women Correlation Summary
| Measurement | Black/African American | Sudanese |
| Minimum | 26.7% | 2.2% |
| Maximum | 100.0% | 64.6% |
| Range | 73.3% | 62.4% |
| Mean | 51.8% | 33.6% |
| Median | 50.9% | 31.5% |
| Interquartile 25% (IQ1) | 39.1% | 26.5% |
| Interquartile 75% (IQ3) | 61.4% | 42.0% |
| Interquartile Range (IQR) | 22.4% | 15.5% |
| Standard Deviation (Sample) | 15.6% | 12.8% |
| Standard Deviation (Population) | 15.6% | 12.6% |
Similar Demographics by Births to Unmarried Women
Demographics Similar to Blacks/African Americans by Births to Unmarried Women
In terms of births to unmarried women, the demographic groups most similar to Blacks/African Americans are Yuman (44.4%, a difference of 0.17%), Colville (45.3%, a difference of 2.3%), Kiowa (43.1%, a difference of 2.7%), Native/Alaskan (43.0%, a difference of 3.0%), and Puerto Rican (45.7%, a difference of 3.1%).
| Demographics | Rating | Rank | Births to Unmarried Women |
| Immigrants | Cuba | 0.0 /100 | #326 | Tragic 41.5% |
| Tsimshian | 0.0 /100 | #327 | Tragic 42.2% |
| Immigrants | Cabo Verde | 0.0 /100 | #328 | Tragic 42.2% |
| Paiute | 0.0 /100 | #329 | Tragic 42.5% |
| Chippewa | 0.0 /100 | #330 | Tragic 42.6% |
| Natives/Alaskans | 0.0 /100 | #331 | Tragic 43.0% |
| Kiowa | 0.0 /100 | #332 | Tragic 43.1% |
| Blacks/African Americans | 0.0 /100 | #333 | Tragic 44.3% |
| Yuman | 0.0 /100 | #334 | Tragic 44.4% |
| Colville | 0.0 /100 | #335 | Tragic 45.3% |
| Puerto Ricans | 0.0 /100 | #336 | Tragic 45.7% |
| Houma | 0.0 /100 | #337 | Tragic 46.6% |
| Arapaho | 0.0 /100 | #338 | Tragic 47.1% |
| Lumbee | 0.0 /100 | #339 | Tragic 48.2% |
| Tohono O'odham | 0.0 /100 | #340 | Tragic 49.8% |
Demographics Similar to Sudanese by Births to Unmarried Women
In terms of births to unmarried women, the demographic groups most similar to Sudanese are Fijian (32.3%, a difference of 0.42%), Colombian (32.2%, a difference of 0.51%), Irish (32.2%, a difference of 0.57%), Tlingit-Haida (32.2%, a difference of 0.59%), and Samoan (32.6%, a difference of 0.67%).
| Demographics | Rating | Rank | Births to Unmarried Women |
| Czechoslovakians | 38.0 /100 | #187 | Fair 32.0% |
| Osage | 37.1 /100 | #188 | Fair 32.1% |
| Immigrants | Kenya | 36.9 /100 | #189 | Fair 32.1% |
| Tlingit-Haida | 32.6 /100 | #190 | Fair 32.2% |
| Irish | 32.4 /100 | #191 | Fair 32.2% |
| Colombians | 31.9 /100 | #192 | Fair 32.2% |
| Fijians | 31.1 /100 | #193 | Fair 32.3% |
| Sudanese | 27.3 /100 | #194 | Fair 32.4% |
| Samoans | 21.9 /100 | #195 | Fair 32.6% |
| Immigrants | Colombia | 21.7 /100 | #196 | Fair 32.6% |
| Immigrants | Immigrants | 20.6 /100 | #197 | Fair 32.7% |
| Costa Ricans | 20.3 /100 | #198 | Fair 32.7% |
| Immigrants | Thailand | 18.9 /100 | #199 | Poor 32.8% |
| Immigrants | Germany | 18.8 /100 | #200 | Poor 32.8% |
| Immigrants | Burma/Myanmar | 16.7 /100 | #201 | Poor 32.9% |