Black/African American vs Immigrants from Somalia Births to Unmarried Women
COMPARE
Black/African American
Immigrants from Somalia
Births to Unmarried Women
Births to Unmarried Women Comparison
Blacks/African Americans
Immigrants from Somalia
44.3%
BIRTHS TO UNMARRIED WOMEN
0.0/ 100
METRIC RATING
333rd/ 347
METRIC RANK
31.4%
BIRTHS TO UNMARRIED WOMEN
58.1/ 100
METRIC RATING
165th/ 347
METRIC RANK
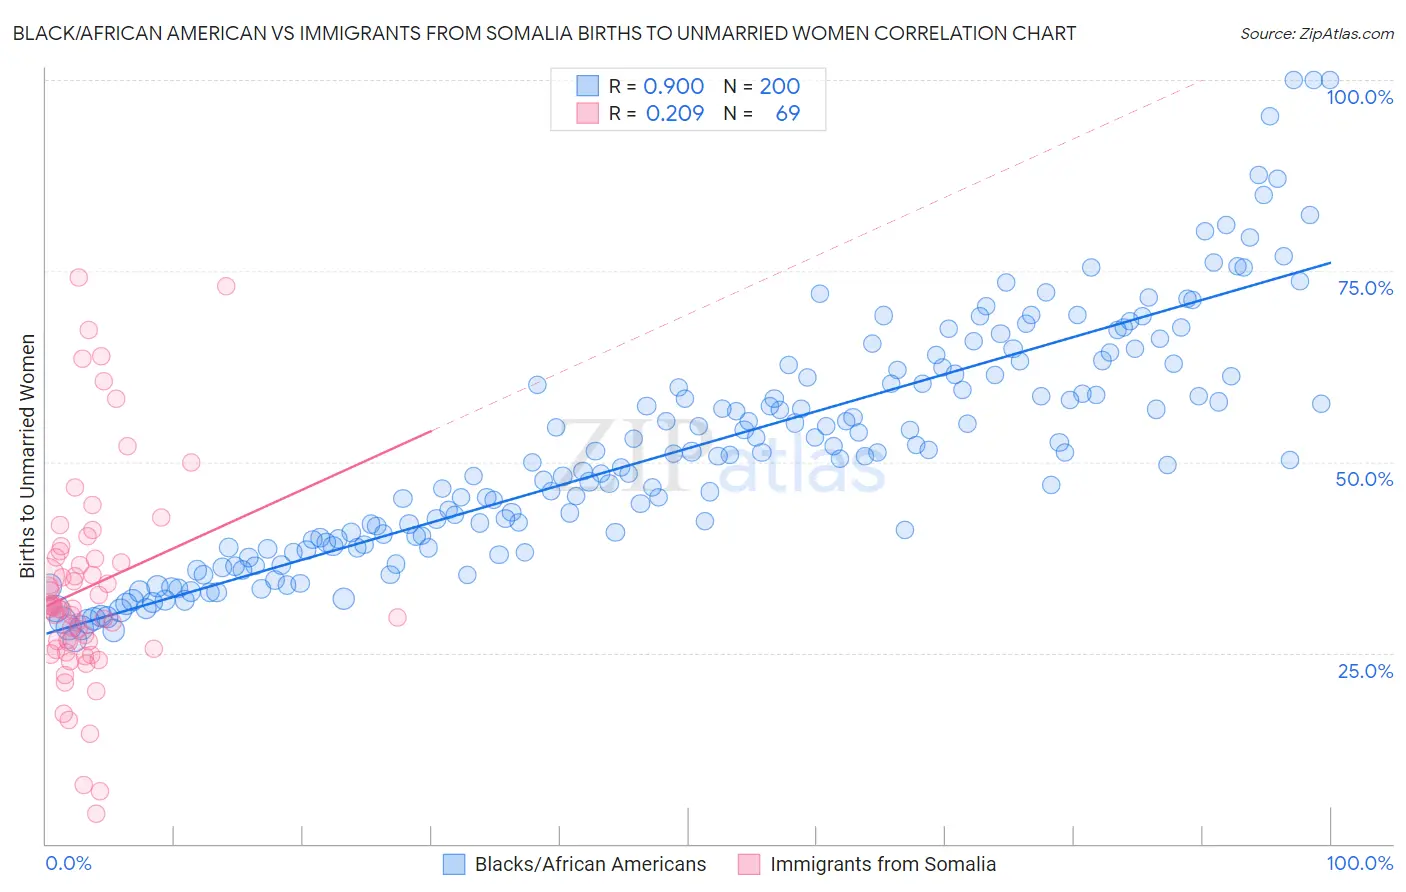
Black/African American vs Immigrants from Somalia Births to Unmarried Women Correlation Chart
The statistical analysis conducted on geographies consisting of 506,152,506 people shows a very strong positive correlation between the proportion of Blacks/African Americans and percentage of births to unmarried women in the United States with a correlation coefficient (R) of 0.900 and weighted average of 44.3%. Similarly, the statistical analysis conducted on geographies consisting of 90,738,238 people shows a weak positive correlation between the proportion of Immigrants from Somalia and percentage of births to unmarried women in the United States with a correlation coefficient (R) of 0.209 and weighted average of 31.4%, a difference of 40.9%.
Births to Unmarried Women Correlation Summary
| Measurement | Black/African American | Immigrants from Somalia |
| Minimum | 26.7% | 4.0% |
| Maximum | 100.0% | 74.1% |
| Range | 73.3% | 70.1% |
| Mean | 51.8% | 33.6% |
| Median | 50.9% | 30.9% |
| Interquartile 25% (IQ1) | 39.1% | 25.5% |
| Interquartile 75% (IQ3) | 61.4% | 37.8% |
| Interquartile Range (IQR) | 22.4% | 12.3% |
| Standard Deviation (Sample) | 15.6% | 14.1% |
| Standard Deviation (Population) | 15.6% | 14.0% |
Similar Demographics by Births to Unmarried Women
Demographics Similar to Blacks/African Americans by Births to Unmarried Women
In terms of births to unmarried women, the demographic groups most similar to Blacks/African Americans are Yuman (44.4%, a difference of 0.17%), Colville (45.3%, a difference of 2.3%), Kiowa (43.1%, a difference of 2.7%), Native/Alaskan (43.0%, a difference of 3.0%), and Puerto Rican (45.7%, a difference of 3.1%).
| Demographics | Rating | Rank | Births to Unmarried Women |
| Immigrants | Cuba | 0.0 /100 | #326 | Tragic 41.5% |
| Tsimshian | 0.0 /100 | #327 | Tragic 42.2% |
| Immigrants | Cabo Verde | 0.0 /100 | #328 | Tragic 42.2% |
| Paiute | 0.0 /100 | #329 | Tragic 42.5% |
| Chippewa | 0.0 /100 | #330 | Tragic 42.6% |
| Natives/Alaskans | 0.0 /100 | #331 | Tragic 43.0% |
| Kiowa | 0.0 /100 | #332 | Tragic 43.1% |
| Blacks/African Americans | 0.0 /100 | #333 | Tragic 44.3% |
| Yuman | 0.0 /100 | #334 | Tragic 44.4% |
| Colville | 0.0 /100 | #335 | Tragic 45.3% |
| Puerto Ricans | 0.0 /100 | #336 | Tragic 45.7% |
| Houma | 0.0 /100 | #337 | Tragic 46.6% |
| Arapaho | 0.0 /100 | #338 | Tragic 47.1% |
| Lumbee | 0.0 /100 | #339 | Tragic 48.2% |
| Tohono O'odham | 0.0 /100 | #340 | Tragic 49.8% |
Demographics Similar to Immigrants from Somalia by Births to Unmarried Women
In terms of births to unmarried women, the demographic groups most similar to Immigrants from Somalia are Peruvian (31.5%, a difference of 0.25%), Dutch (31.5%, a difference of 0.28%), Belgian (31.6%, a difference of 0.55%), Slavic (31.6%, a difference of 0.59%), and Hungarian (31.2%, a difference of 0.60%).
| Demographics | Rating | Rank | Births to Unmarried Women |
| Austrians | 69.9 /100 | #158 | Good 31.0% |
| Immigrants | England | 69.4 /100 | #159 | Good 31.1% |
| Immigrants | Western Europe | 69.3 /100 | #160 | Good 31.1% |
| Immigrants | Southern Europe | 68.7 /100 | #161 | Good 31.1% |
| Slovenes | 65.9 /100 | #162 | Good 31.2% |
| Immigrants | Chile | 65.7 /100 | #163 | Good 31.2% |
| Hungarians | 64.1 /100 | #164 | Good 31.2% |
| Immigrants | Somalia | 58.1 /100 | #165 | Average 31.4% |
| Peruvians | 55.5 /100 | #166 | Average 31.5% |
| Dutch | 55.3 /100 | #167 | Average 31.5% |
| Belgians | 52.4 /100 | #168 | Average 31.6% |
| Slavs | 52.0 /100 | #169 | Average 31.6% |
| Guamanians/Chamorros | 51.3 /100 | #170 | Average 31.6% |
| Finns | 50.5 /100 | #171 | Average 31.7% |
| Immigrants | Eritrea | 50.4 /100 | #172 | Average 31.7% |