Black/African American vs Immigrants from Ethiopia Births to Unmarried Women
COMPARE
Black/African American
Immigrants from Ethiopia
Births to Unmarried Women
Births to Unmarried Women Comparison
Blacks/African Americans
Immigrants from Ethiopia
44.3%
BIRTHS TO UNMARRIED WOMEN
0.0/ 100
METRIC RATING
333rd/ 347
METRIC RANK
29.7%
BIRTHS TO UNMARRIED WOMEN
93.4/ 100
METRIC RATING
110th/ 347
METRIC RANK
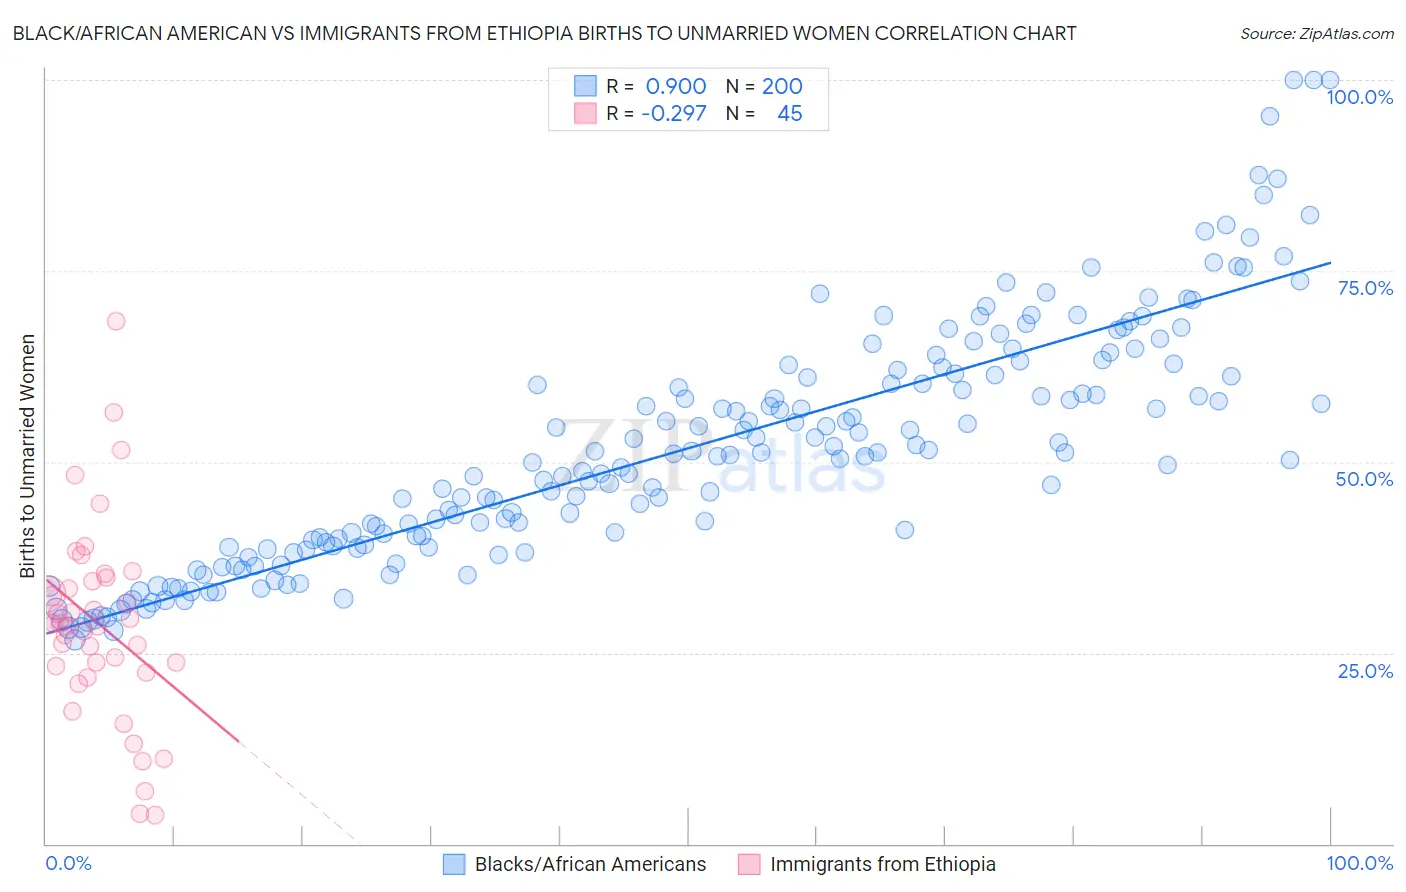
Black/African American vs Immigrants from Ethiopia Births to Unmarried Women Correlation Chart
The statistical analysis conducted on geographies consisting of 506,152,506 people shows a very strong positive correlation between the proportion of Blacks/African Americans and percentage of births to unmarried women in the United States with a correlation coefficient (R) of 0.900 and weighted average of 44.3%. Similarly, the statistical analysis conducted on geographies consisting of 204,461,037 people shows a weak negative correlation between the proportion of Immigrants from Ethiopia and percentage of births to unmarried women in the United States with a correlation coefficient (R) of -0.297 and weighted average of 29.7%, a difference of 49.2%.
Births to Unmarried Women Correlation Summary
| Measurement | Black/African American | Immigrants from Ethiopia |
| Minimum | 26.7% | 3.7% |
| Maximum | 100.0% | 68.3% |
| Range | 73.3% | 64.6% |
| Mean | 51.8% | 28.8% |
| Median | 50.9% | 28.8% |
| Interquartile 25% (IQ1) | 39.1% | 22.8% |
| Interquartile 75% (IQ3) | 61.4% | 34.7% |
| Interquartile Range (IQR) | 22.4% | 11.8% |
| Standard Deviation (Sample) | 15.6% | 12.8% |
| Standard Deviation (Population) | 15.6% | 12.6% |
Similar Demographics by Births to Unmarried Women
Demographics Similar to Blacks/African Americans by Births to Unmarried Women
In terms of births to unmarried women, the demographic groups most similar to Blacks/African Americans are Yuman (44.4%, a difference of 0.17%), Colville (45.3%, a difference of 2.3%), Kiowa (43.1%, a difference of 2.7%), Native/Alaskan (43.0%, a difference of 3.0%), and Puerto Rican (45.7%, a difference of 3.1%).
| Demographics | Rating | Rank | Births to Unmarried Women |
| Immigrants | Cuba | 0.0 /100 | #326 | Tragic 41.5% |
| Tsimshian | 0.0 /100 | #327 | Tragic 42.2% |
| Immigrants | Cabo Verde | 0.0 /100 | #328 | Tragic 42.2% |
| Paiute | 0.0 /100 | #329 | Tragic 42.5% |
| Chippewa | 0.0 /100 | #330 | Tragic 42.6% |
| Natives/Alaskans | 0.0 /100 | #331 | Tragic 43.0% |
| Kiowa | 0.0 /100 | #332 | Tragic 43.1% |
| Blacks/African Americans | 0.0 /100 | #333 | Tragic 44.3% |
| Yuman | 0.0 /100 | #334 | Tragic 44.4% |
| Colville | 0.0 /100 | #335 | Tragic 45.3% |
| Puerto Ricans | 0.0 /100 | #336 | Tragic 45.7% |
| Houma | 0.0 /100 | #337 | Tragic 46.6% |
| Arapaho | 0.0 /100 | #338 | Tragic 47.1% |
| Lumbee | 0.0 /100 | #339 | Tragic 48.2% |
| Tohono O'odham | 0.0 /100 | #340 | Tragic 49.8% |
Demographics Similar to Immigrants from Ethiopia by Births to Unmarried Women
In terms of births to unmarried women, the demographic groups most similar to Immigrants from Ethiopia are Greek (29.7%, a difference of 0.030%), Paraguayan (29.7%, a difference of 0.070%), Immigrants from Hungary (29.7%, a difference of 0.14%), Immigrants from Brazil (29.6%, a difference of 0.15%), and Basque (29.7%, a difference of 0.15%).
| Demographics | Rating | Rank | Births to Unmarried Women |
| Lebanese | 94.4 /100 | #103 | Exceptional 29.5% |
| Lithuanians | 94.4 /100 | #104 | Exceptional 29.6% |
| Immigrants | Nepal | 94.3 /100 | #105 | Exceptional 29.6% |
| Swedes | 93.8 /100 | #106 | Exceptional 29.6% |
| Immigrants | Brazil | 93.7 /100 | #107 | Exceptional 29.6% |
| Paraguayans | 93.5 /100 | #108 | Exceptional 29.7% |
| Greeks | 93.4 /100 | #109 | Exceptional 29.7% |
| Immigrants | Ethiopia | 93.4 /100 | #110 | Exceptional 29.7% |
| Immigrants | Hungary | 93.0 /100 | #111 | Exceptional 29.7% |
| Basques | 93.0 /100 | #112 | Exceptional 29.7% |
| Scandinavians | 92.7 /100 | #113 | Exceptional 29.8% |
| Immigrants | Croatia | 92.6 /100 | #114 | Exceptional 29.8% |
| Ethiopians | 91.9 /100 | #115 | Exceptional 29.8% |
| Immigrants | Italy | 91.7 /100 | #116 | Exceptional 29.9% |
| Immigrants | Netherlands | 91.1 /100 | #117 | Exceptional 29.9% |