Black/African American vs Immigrants from Vietnam Births to Unmarried Women
COMPARE
Black/African American
Immigrants from Vietnam
Births to Unmarried Women
Births to Unmarried Women Comparison
Blacks/African Americans
Immigrants from Vietnam
44.3%
BIRTHS TO UNMARRIED WOMEN
0.0/ 100
METRIC RATING
333rd/ 347
METRIC RANK
29.3%
BIRTHS TO UNMARRIED WOMEN
96.1/ 100
METRIC RATING
95th/ 347
METRIC RANK
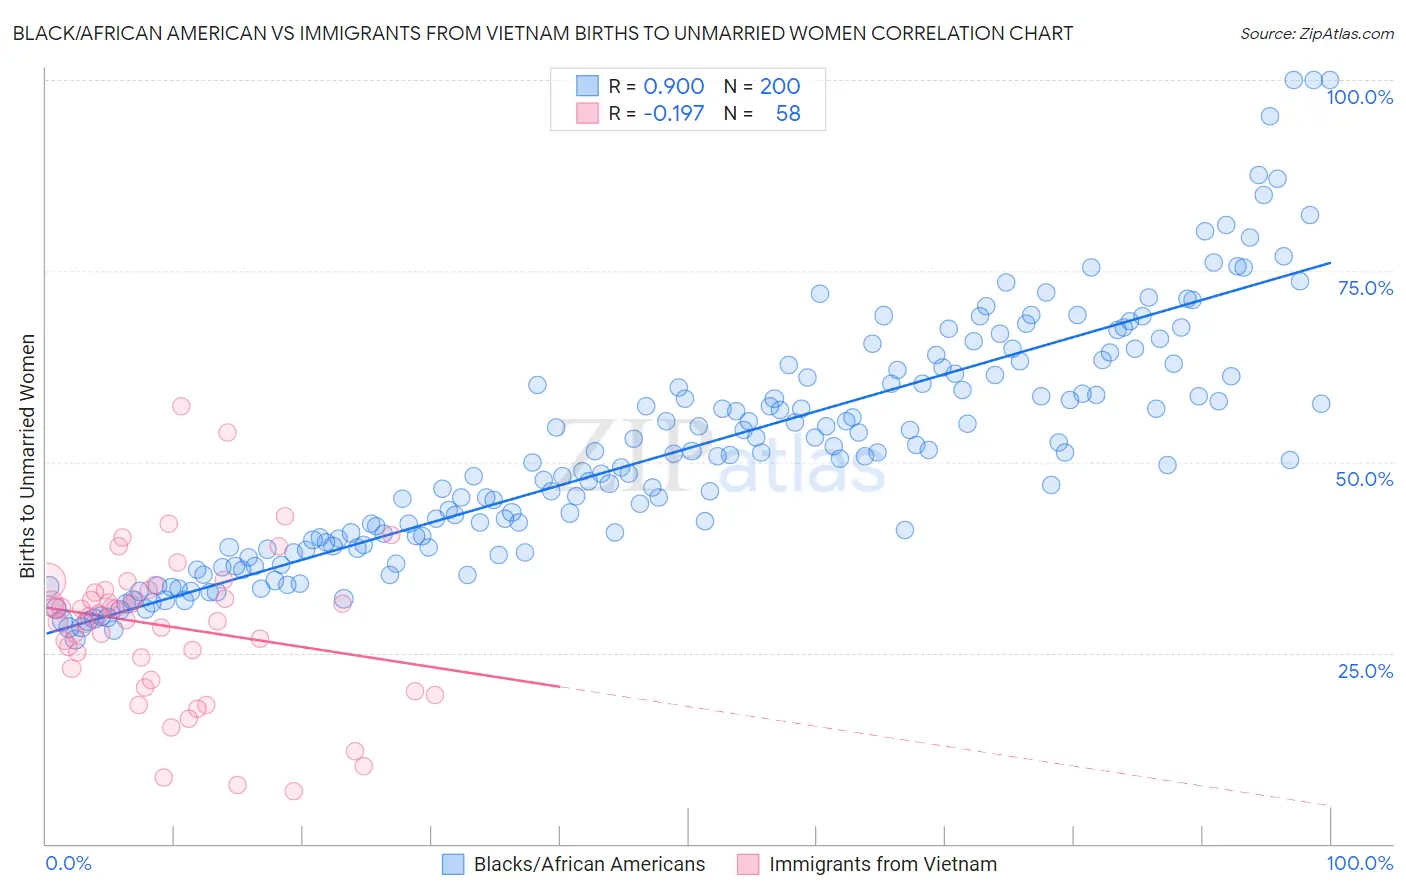
Black/African American vs Immigrants from Vietnam Births to Unmarried Women Correlation Chart
The statistical analysis conducted on geographies consisting of 506,152,506 people shows a very strong positive correlation between the proportion of Blacks/African Americans and percentage of births to unmarried women in the United States with a correlation coefficient (R) of 0.900 and weighted average of 44.3%. Similarly, the statistical analysis conducted on geographies consisting of 380,517,286 people shows a poor negative correlation between the proportion of Immigrants from Vietnam and percentage of births to unmarried women in the United States with a correlation coefficient (R) of -0.197 and weighted average of 29.3%, a difference of 51.3%.
Births to Unmarried Women Correlation Summary
| Measurement | Black/African American | Immigrants from Vietnam |
| Minimum | 26.7% | 6.9% |
| Maximum | 100.0% | 57.3% |
| Range | 73.3% | 50.4% |
| Mean | 51.8% | 28.5% |
| Median | 50.9% | 29.9% |
| Interquartile 25% (IQ1) | 39.1% | 22.9% |
| Interquartile 75% (IQ3) | 61.4% | 33.2% |
| Interquartile Range (IQR) | 22.4% | 10.3% |
| Standard Deviation (Sample) | 15.6% | 9.9% |
| Standard Deviation (Population) | 15.6% | 9.9% |
Similar Demographics by Births to Unmarried Women
Demographics Similar to Blacks/African Americans by Births to Unmarried Women
In terms of births to unmarried women, the demographic groups most similar to Blacks/African Americans are Yuman (44.4%, a difference of 0.17%), Colville (45.3%, a difference of 2.3%), Kiowa (43.1%, a difference of 2.7%), Native/Alaskan (43.0%, a difference of 3.0%), and Puerto Rican (45.7%, a difference of 3.1%).
| Demographics | Rating | Rank | Births to Unmarried Women |
| Immigrants | Cuba | 0.0 /100 | #326 | Tragic 41.5% |
| Tsimshian | 0.0 /100 | #327 | Tragic 42.2% |
| Immigrants | Cabo Verde | 0.0 /100 | #328 | Tragic 42.2% |
| Paiute | 0.0 /100 | #329 | Tragic 42.5% |
| Chippewa | 0.0 /100 | #330 | Tragic 42.6% |
| Natives/Alaskans | 0.0 /100 | #331 | Tragic 43.0% |
| Kiowa | 0.0 /100 | #332 | Tragic 43.1% |
| Blacks/African Americans | 0.0 /100 | #333 | Tragic 44.3% |
| Yuman | 0.0 /100 | #334 | Tragic 44.4% |
| Colville | 0.0 /100 | #335 | Tragic 45.3% |
| Puerto Ricans | 0.0 /100 | #336 | Tragic 45.7% |
| Houma | 0.0 /100 | #337 | Tragic 46.6% |
| Arapaho | 0.0 /100 | #338 | Tragic 47.1% |
| Lumbee | 0.0 /100 | #339 | Tragic 48.2% |
| Tohono O'odham | 0.0 /100 | #340 | Tragic 49.8% |
Demographics Similar to Immigrants from Vietnam by Births to Unmarried Women
In terms of births to unmarried women, the demographic groups most similar to Immigrants from Vietnam are Ukrainian (29.2%, a difference of 0.13%), Norwegian (29.3%, a difference of 0.23%), Estonian (29.2%, a difference of 0.26%), Immigrants from South Africa (29.3%, a difference of 0.27%), and Arab (29.2%, a difference of 0.30%).
| Demographics | Rating | Rank | Births to Unmarried Women |
| Immigrants | France | 97.3 /100 | #88 | Exceptional 29.0% |
| Immigrants | Saudi Arabia | 97.0 /100 | #89 | Exceptional 29.1% |
| Immigrants | Latvia | 96.8 /100 | #90 | Exceptional 29.1% |
| Immigrants | Fiji | 96.6 /100 | #91 | Exceptional 29.2% |
| Arabs | 96.5 /100 | #92 | Exceptional 29.2% |
| Estonians | 96.5 /100 | #93 | Exceptional 29.2% |
| Ukrainians | 96.3 /100 | #94 | Exceptional 29.2% |
| Immigrants | Vietnam | 96.1 /100 | #95 | Exceptional 29.3% |
| Norwegians | 95.8 /100 | #96 | Exceptional 29.3% |
| Immigrants | South Africa | 95.7 /100 | #97 | Exceptional 29.3% |
| Immigrants | Syria | 95.7 /100 | #98 | Exceptional 29.4% |
| Immigrants | Denmark | 95.3 /100 | #99 | Exceptional 29.4% |
| Luxembourgers | 95.2 /100 | #100 | Exceptional 29.4% |
| Immigrants | Northern Africa | 94.7 /100 | #101 | Exceptional 29.5% |
| Australians | 94.6 /100 | #102 | Exceptional 29.5% |