White/Caucasian Births to Unmarried Women
COMPARE
White/Caucasian
Select to Compare
Births to Unmarried Women
White/Caucasian Births to Unmarried Women
33.3%
BIRTHS TO UNMARRIED WOMEN
10.7/ 100
METRIC RATING
209th/ 347
METRIC RANK
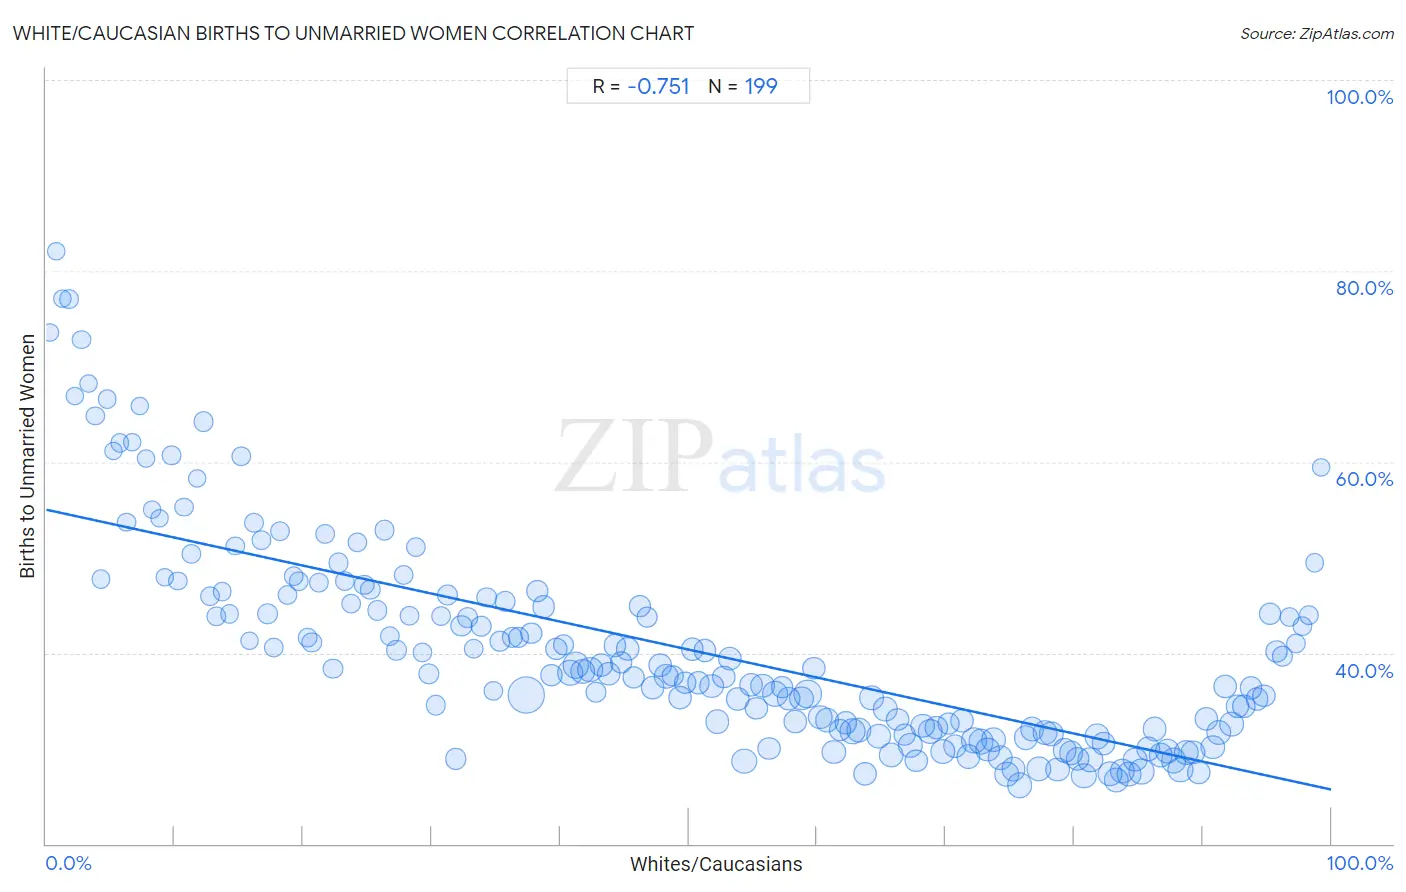
White/Caucasian Births to Unmarried Women Correlation Chart
The statistical analysis conducted on geographies consisting of 513,410,964 people shows a strong negative correlation between the proportion of Whites/Caucasians and percentage of births to unmarried women in the United States with a correlation coefficient (R) of -0.751 and weighted average of 33.3%. On average, for every 1% (one percent) increase in Whites/Caucasians within a typical geography, there is a decrease of 0.29% in percentage of births to unmarried women.
It is essential to understand that the correlation between the percentage of Whites/Caucasians and percentage of births to unmarried women does not imply a direct cause-and-effect relationship. It remains uncertain whether the presence of Whites/Caucasians influences an upward or downward trend in the level of percentage of births to unmarried women within an area, or if Whites/Caucasians simply ended up residing in those areas with higher or lower levels of percentage of births to unmarried women due to other factors.
Demographics Similar to Whites/Caucasians by Births to Unmarried Women
In terms of births to unmarried women, the demographic groups most similar to Whites/Caucasians are Scotch-Irish (33.3%, a difference of 0.0%), Ecuadorian (33.3%, a difference of 0.050%), Celtic (33.3%, a difference of 0.12%), Hawaiian (33.2%, a difference of 0.14%), and Immigrants from Sudan (33.2%, a difference of 0.17%).
| Demographics | Rating | Rank | Births to Unmarried Women |
| Immigrants from Micronesia | 16.6 /100 | #202 | Poor 32.9% |
| Ute | 14.4 /100 | #203 | Poor 33.0% |
| Immigrants from Africa | 14.3 /100 | #204 | Poor 33.0% |
| German Russians | 13.1 /100 | #205 | Poor 33.1% |
| Uruguayans | 12.8 /100 | #206 | Poor 33.1% |
| Immigrants from Sudan | 11.5 /100 | #207 | Poor 33.2% |
| Hawaiians | 11.3 /100 | #208 | Poor 33.2% |
| Whites/Caucasians | 10.7 /100 | #209 | Poor 33.3% |
| Scotch-Irish | 10.7 /100 | #210 | Poor 33.3% |
| Ecuadorians | 10.5 /100 | #211 | Poor 33.3% |
| Celtics | 10.2 /100 | #212 | Poor 33.3% |
| Immigrants from Costa Rica | 9.5 /100 | #213 | Tragic 33.4% |
| Slovaks | 9.3 /100 | #214 | Tragic 33.4% |
| French | 8.7 /100 | #215 | Tragic 33.4% |
| Nepalese | 7.8 /100 | #216 | Tragic 33.5% |
White/Caucasian Births to Unmarried Women Correlation Summary
| Measurement | White/Caucasian Data | Births to Unmarried Women Data |
| Minimum | 0.31% | 26.1% |
| Maximum | 99.2% | 82.1% |
| Range | 98.9% | 56.0% |
| Mean | 49.8% | 40.4% |
| Median | 49.7% | 37.8% |
| Interquartile 25% (IQ1) | 24.8% | 31.7% |
| Interquartile 75% (IQ3) | 74.8% | 45.8% |
| Interquartile Range (IQR) | 50.0% | 14.1% |
| Standard Deviation (Sample) | 28.8% | 11.2% |
| Standard Deviation (Population) | 28.7% | 11.2% |
Correlation Details
| White/Caucasian Percentile | Sample Size | Births to Unmarried Women |
[ 0.0% - 0.5% ] 0.31% | 49,302 | 73.5% |
[ 0.5% - 1.0% ] 0.78% | 57,795 | 82.1% |
[ 1.0% - 1.5% ] 1.26% | 168,155 | 77.1% |
[ 1.5% - 2.0% ] 1.77% | 449,851 | 77.1% |
[ 2.0% - 2.5% ] 2.21% | 300,137 | 66.9% |
[ 2.5% - 3.0% ] 2.76% | 522,127 | 72.8% |
[ 3.0% - 3.5% ] 3.26% | 332,590 | 68.2% |
[ 3.5% - 4.0% ] 3.80% | 497,068 | 64.8% |
[ 4.0% - 4.5% ] 4.25% | 454,616 | 47.7% |
[ 4.5% - 5.0% ] 4.75% | 420,562 | 66.6% |
[ 5.0% - 5.5% ] 5.23% | 426,147 | 61.2% |
[ 5.5% - 6.0% ] 5.73% | 334,501 | 62.0% |
[ 6.0% - 6.5% ] 6.27% | 438,592 | 53.7% |
[ 6.5% - 7.0% ] 6.68% | 416,608 | 62.1% |
[ 7.0% - 7.5% ] 7.30% | 351,726 | 65.8% |
[ 7.5% - 8.0% ] 7.78% | 335,957 | 60.4% |
[ 8.0% - 8.5% ] 8.24% | 559,975 | 55.0% |
[ 8.5% - 9.0% ] 8.81% | 655,571 | 54.1% |
[ 9.0% - 9.5% ] 9.25% | 373,316 | 48.0% |
[ 9.5% - 10.0% ] 9.74% | 478,462 | 60.7% |
[ 10.0% - 10.5% ] 10.22% | 415,175 | 47.5% |
[ 10.5% - 11.0% ] 10.73% | 504,128 | 55.3% |
[ 11.0% - 11.5% ] 11.28% | 705,043 | 50.4% |
[ 11.5% - 12.0% ] 11.74% | 441,825 | 58.3% |
[ 12.0% - 12.5% ] 12.21% | 1,165,480 | 64.2% |
[ 12.5% - 13.0% ] 12.74% | 874,299 | 46.0% |
[ 13.0% - 13.5% ] 13.27% | 768,702 | 43.8% |
[ 13.5% - 14.0% ] 13.70% | 433,312 | 46.4% |
[ 14.0% - 14.5% ] 14.27% | 702,229 | 44.1% |
[ 14.5% - 15.0% ] 14.70% | 498,823 | 51.2% |
[ 15.0% - 15.5% ] 15.17% | 843,027 | 60.6% |
[ 15.5% - 16.0% ] 15.81% | 687,819 | 41.3% |
[ 16.0% - 16.5% ] 16.15% | 538,543 | 53.6% |
[ 16.5% - 17.0% ] 16.75% | 638,481 | 51.8% |
[ 17.0% - 17.5% ] 17.25% | 1,643,177 | 44.1% |
[ 17.5% - 18.0% ] 17.71% | 864,928 | 40.6% |
[ 18.0% - 18.5% ] 18.21% | 895,268 | 52.7% |
[ 18.5% - 19.0% ] 18.75% | 933,489 | 46.0% |
[ 19.0% - 19.5% ] 19.26% | 973,341 | 48.0% |
[ 19.5% - 20.0% ] 19.69% | 890,235 | 47.6% |
[ 20.0% - 20.5% ] 20.31% | 749,892 | 41.6% |
[ 20.5% - 21.0% ] 20.67% | 979,645 | 41.0% |
[ 21.0% - 21.5% ] 21.23% | 684,545 | 47.3% |
[ 21.5% - 22.0% ] 21.70% | 673,389 | 52.4% |
[ 22.0% - 22.5% ] 22.31% | 1,028,749 | 38.3% |
[ 22.5% - 23.0% ] 22.71% | 1,199,940 | 49.4% |
[ 23.0% - 23.5% ] 23.23% | 1,087,544 | 47.5% |
[ 23.5% - 24.0% ] 23.75% | 1,018,012 | 45.2% |
[ 24.0% - 24.5% ] 24.24% | 1,069,903 | 51.6% |
[ 24.5% - 25.0% ] 24.76% | 1,098,268 | 47.2% |
[ 25.0% - 25.5% ] 25.23% | 1,341,974 | 46.6% |
[ 25.5% - 26.0% ] 25.75% | 1,139,655 | 44.4% |
[ 26.0% - 26.5% ] 26.33% | 1,539,548 | 52.9% |
[ 26.5% - 27.0% ] 26.74% | 1,045,888 | 41.7% |
[ 27.0% - 27.5% ] 27.27% | 1,392,939 | 40.3% |
[ 27.5% - 28.0% ] 27.80% | 971,836 | 48.1% |
[ 28.0% - 28.5% ] 28.27% | 1,583,912 | 43.9% |
[ 28.5% - 29.0% ] 28.77% | 1,390,164 | 51.1% |
[ 29.0% - 29.5% ] 29.28% | 965,615 | 40.1% |
[ 29.5% - 30.0% ] 29.74% | 1,581,099 | 37.7% |
[ 30.0% - 30.5% ] 30.32% | 1,469,703 | 34.5% |
[ 30.5% - 31.0% ] 30.75% | 1,131,435 | 43.9% |
[ 31.0% - 31.5% ] 31.24% | 1,672,854 | 46.1% |
[ 31.5% - 32.0% ] 31.88% | 2,347,353 | 28.9% |
[ 32.0% - 32.5% ] 32.29% | 2,311,629 | 42.8% |
[ 32.5% - 33.0% ] 32.77% | 1,573,374 | 43.6% |
[ 33.0% - 33.5% ] 33.27% | 933,014 | 40.5% |
[ 33.5% - 34.0% ] 33.82% | 1,818,031 | 42.8% |
[ 34.0% - 34.5% ] 34.27% | 1,107,102 | 45.8% |
[ 34.5% - 35.0% ] 34.79% | 1,390,115 | 36.0% |
[ 35.0% - 35.5% ] 35.27% | 1,773,501 | 41.2% |
[ 35.5% - 36.0% ] 35.74% | 1,601,382 | 45.4% |
[ 36.0% - 36.5% ] 36.25% | 1,884,211 | 41.6% |
[ 36.5% - 37.0% ] 36.75% | 1,957,645 | 41.7% |
[ 37.0% - 37.5% ] 37.37% | 12,597,904 | 35.6% |
[ 37.5% - 38.0% ] 37.71% | 2,454,037 | 42.0% |
[ 38.0% - 38.5% ] 38.25% | 2,843,312 | 46.5% |
[ 38.5% - 39.0% ] 38.71% | 2,721,145 | 44.8% |
[ 39.0% - 39.5% ] 39.28% | 2,316,918 | 37.7% |
[ 39.5% - 40.0% ] 39.72% | 2,397,667 | 40.4% |
[ 40.0% - 40.5% ] 40.23% | 1,974,952 | 40.9% |
[ 40.5% - 41.0% ] 40.77% | 4,799,646 | 37.9% |
[ 41.0% - 41.5% ] 41.21% | 5,603,891 | 38.7% |
[ 41.5% - 42.0% ] 41.77% | 3,970,407 | 38.0% |
[ 42.0% - 42.5% ] 42.32% | 4,795,080 | 38.2% |
[ 42.5% - 43.0% ] 42.76% | 2,045,224 | 35.8% |
[ 43.0% - 43.5% ] 43.19% | 3,288,984 | 38.7% |
[ 43.5% - 44.0% ] 43.79% | 3,394,458 | 37.8% |
[ 44.0% - 44.5% ] 44.24% | 2,724,405 | 40.8% |
[ 44.5% - 45.0% ] 44.74% | 2,669,565 | 39.0% |
[ 45.0% - 45.5% ] 45.27% | 3,145,100 | 40.4% |
[ 45.5% - 46.0% ] 45.71% | 2,694,506 | 37.4% |
[ 46.0% - 46.5% ] 46.22% | 2,704,560 | 44.9% |
[ 46.5% - 47.0% ] 46.76% | 2,214,977 | 43.7% |
[ 47.0% - 47.5% ] 47.21% | 3,204,200 | 36.3% |
[ 47.5% - 48.0% ] 47.75% | 3,156,892 | 38.7% |
[ 48.0% - 48.5% ] 48.24% | 4,188,984 | 37.5% |
[ 48.5% - 49.0% ] 48.73% | 2,267,981 | 37.6% |
[ 49.0% - 49.5% ] 49.29% | 3,282,699 | 35.3% |
[ 49.5% - 50.0% ] 49.75% | 2,272,643 | 36.9% |
[ 50.0% - 50.5% ] 50.26% | 2,813,042 | 40.4% |
[ 50.5% - 51.0% ] 50.75% | 3,044,550 | 36.9% |
[ 51.0% - 51.5% ] 51.23% | 2,692,070 | 40.2% |
[ 51.5% - 52.0% ] 51.79% | 3,670,575 | 36.5% |
[ 52.0% - 52.5% ] 52.20% | 3,692,514 | 32.8% |
[ 52.5% - 53.0% ] 52.76% | 3,293,137 | 37.5% |
[ 53.0% - 53.5% ] 53.23% | 3,584,440 | 39.4% |
[ 53.5% - 54.0% ] 53.78% | 3,113,726 | 35.2% |
[ 54.0% - 54.5% ] 54.32% | 4,374,705 | 28.7% |
[ 54.5% - 55.0% ] 54.82% | 3,633,735 | 36.6% |
[ 55.0% - 55.5% ] 55.28% | 3,165,021 | 34.2% |
[ 55.5% - 56.0% ] 55.75% | 4,092,539 | 36.6% |
[ 56.0% - 56.5% ] 56.24% | 2,958,927 | 30.0% |
[ 56.5% - 57.0% ] 56.71% | 4,956,113 | 35.7% |
[ 57.0% - 57.5% ] 57.25% | 3,091,896 | 36.4% |
[ 57.5% - 58.0% ] 57.74% | 3,500,887 | 35.2% |
[ 58.0% - 58.5% ] 58.26% | 3,061,383 | 32.8% |
[ 58.5% - 59.0% ] 58.76% | 3,865,088 | 35.2% |
[ 59.0% - 59.5% ] 59.26% | 6,442,415 | 35.7% |
[ 59.5% - 60.0% ] 59.75% | 3,246,221 | 38.4% |
[ 60.0% - 60.5% ] 60.23% | 3,940,713 | 33.3% |
[ 60.5% - 61.0% ] 60.75% | 4,015,378 | 33.0% |
[ 61.0% - 61.5% ] 61.31% | 4,031,784 | 29.6% |
[ 61.5% - 62.0% ] 61.77% | 2,527,819 | 31.9% |
[ 62.0% - 62.5% ] 62.22% | 3,086,326 | 32.7% |
[ 62.5% - 63.0% ] 62.76% | 5,054,161 | 31.8% |
[ 63.0% - 63.5% ] 63.24% | 4,111,981 | 31.9% |
[ 63.5% - 64.0% ] 63.72% | 3,292,420 | 27.4% |
[ 64.0% - 64.5% ] 64.23% | 3,791,928 | 35.3% |
[ 64.5% - 65.0% ] 64.77% | 4,317,009 | 31.3% |
[ 65.0% - 65.5% ] 65.30% | 3,834,326 | 34.1% |
[ 65.5% - 66.0% ] 65.73% | 4,319,695 | 29.3% |
[ 66.0% - 66.5% ] 66.26% | 3,236,996 | 33.0% |
[ 66.5% - 67.0% ] 66.78% | 3,072,132 | 31.4% |
[ 67.0% - 67.5% ] 67.25% | 3,791,382 | 30.3% |
[ 67.5% - 68.0% ] 67.75% | 3,261,948 | 28.7% |
[ 68.0% - 68.5% ] 68.22% | 3,973,805 | 32.4% |
[ 68.5% - 69.0% ] 68.77% | 3,905,882 | 31.7% |
[ 69.0% - 69.5% ] 69.23% | 3,270,872 | 32.1% |
[ 69.5% - 70.0% ] 69.76% | 3,864,127 | 29.7% |
[ 70.0% - 70.5% ] 70.24% | 2,843,200 | 32.6% |
[ 70.5% - 71.0% ] 70.74% | 3,485,367 | 30.2% |
[ 71.0% - 71.5% ] 71.28% | 4,023,483 | 32.9% |
[ 71.5% - 72.0% ] 71.75% | 3,804,143 | 29.1% |
[ 72.0% - 72.5% ] 72.22% | 4,582,670 | 30.8% |
[ 72.5% - 73.0% ] 72.71% | 4,523,214 | 30.7% |
[ 73.0% - 73.5% ] 73.26% | 4,045,953 | 29.9% |
[ 73.5% - 74.0% ] 73.74% | 4,578,298 | 30.9% |
[ 74.0% - 74.5% ] 74.24% | 3,972,250 | 29.0% |
[ 74.5% - 75.0% ] 74.76% | 3,519,348 | 27.3% |
[ 75.0% - 75.5% ] 75.27% | 3,784,595 | 27.8% |
[ 75.5% - 76.0% ] 75.73% | 4,702,423 | 26.1% |
[ 76.0% - 76.5% ] 76.24% | 3,938,363 | 31.1% |
[ 76.5% - 77.0% ] 76.75% | 3,838,871 | 32.0% |
[ 77.0% - 77.5% ] 77.25% | 4,117,641 | 27.9% |
[ 77.5% - 78.0% ] 77.76% | 4,096,697 | 31.6% |
[ 78.0% - 78.5% ] 78.25% | 4,050,720 | 31.5% |
[ 78.5% - 79.0% ] 78.74% | 4,099,828 | 27.8% |
[ 79.0% - 79.5% ] 79.24% | 3,736,858 | 29.8% |
[ 79.5% - 80.0% ] 79.75% | 3,637,286 | 29.5% |
[ 80.0% - 80.5% ] 80.24% | 3,259,903 | 28.9% |
[ 80.5% - 81.0% ] 80.76% | 4,911,738 | 27.1% |
[ 81.0% - 81.5% ] 81.26% | 4,583,737 | 28.8% |
[ 81.5% - 82.0% ] 81.76% | 4,784,088 | 31.2% |
[ 82.0% - 82.5% ] 82.25% | 3,662,269 | 30.5% |
[ 82.5% - 83.0% ] 82.75% | 4,235,245 | 27.3% |
[ 83.0% - 83.5% ] 83.25% | 4,190,185 | 26.7% |
[ 83.5% - 84.0% ] 83.75% | 4,405,319 | 27.7% |
[ 84.0% - 84.5% ] 84.26% | 3,859,827 | 27.3% |
[ 84.5% - 85.0% ] 84.75% | 4,011,999 | 28.8% |
[ 85.0% - 85.5% ] 85.23% | 4,710,931 | 27.6% |
[ 85.5% - 86.0% ] 85.76% | 4,024,536 | 29.9% |
[ 86.0% - 86.5% ] 86.25% | 3,886,704 | 32.0% |
[ 86.5% - 87.0% ] 86.74% | 4,105,289 | 29.3% |
[ 87.0% - 87.5% ] 87.26% | 4,346,957 | 29.7% |
[ 87.5% - 88.0% ] 87.75% | 4,384,802 | 28.7% |
[ 88.0% - 88.5% ] 88.25% | 4,482,709 | 27.7% |
[ 88.5% - 89.0% ] 88.75% | 4,168,408 | 29.5% |
[ 89.0% - 89.5% ] 89.25% | 3,650,497 | 29.5% |
[ 89.5% - 90.0% ] 89.74% | 3,368,357 | 27.5% |
[ 90.0% - 90.5% ] 90.26% | 3,232,050 | 33.1% |
[ 90.5% - 91.0% ] 90.77% | 3,803,424 | 30.1% |
[ 91.0% - 91.5% ] 91.24% | 4,240,528 | 31.6% |
[ 91.5% - 92.0% ] 91.74% | 3,143,943 | 36.5% |
[ 92.0% - 92.5% ] 92.25% | 3,745,672 | 32.5% |
[ 92.5% - 93.0% ] 92.75% | 3,381,340 | 34.4% |
[ 93.0% - 93.5% ] 93.24% | 3,305,807 | 34.4% |
[ 93.5% - 94.0% ] 93.75% | 2,839,582 | 36.3% |
[ 94.0% - 94.5% ] 94.25% | 3,047,705 | 35.2% |
[ 94.5% - 95.0% ] 94.74% | 3,213,828 | 35.5% |
[ 95.0% - 95.5% ] 95.26% | 2,532,508 | 44.1% |
[ 95.5% - 96.0% ] 95.75% | 2,209,631 | 40.1% |
[ 96.0% - 96.5% ] 96.24% | 1,731,430 | 39.6% |
[ 96.5% - 97.0% ] 96.75% | 1,518,384 | 43.7% |
[ 97.0% - 97.5% ] 97.25% | 1,301,147 | 41.0% |
[ 97.5% - 98.0% ] 97.73% | 1,027,564 | 42.8% |
[ 98.0% - 98.5% ] 98.25% | 684,859 | 44.0% |
[ 98.5% - 99.0% ] 98.72% | 516,332 | 49.4% |
[ 99.0% - 99.5% ] 99.22% | 242,469 | 59.4% |