South American vs Aleut College, Under 1 year
COMPARE
South American
Aleut
College, Under 1 year
College, Under 1 year Comparison
South Americans
Aleuts
64.2%
COLLEGE, UNDER 1 YEAR
16.2/ 100
METRIC RATING
202nd/ 347
METRIC RANK
62.2%
COLLEGE, UNDER 1 YEAR
1.1/ 100
METRIC RATING
240th/ 347
METRIC RANK
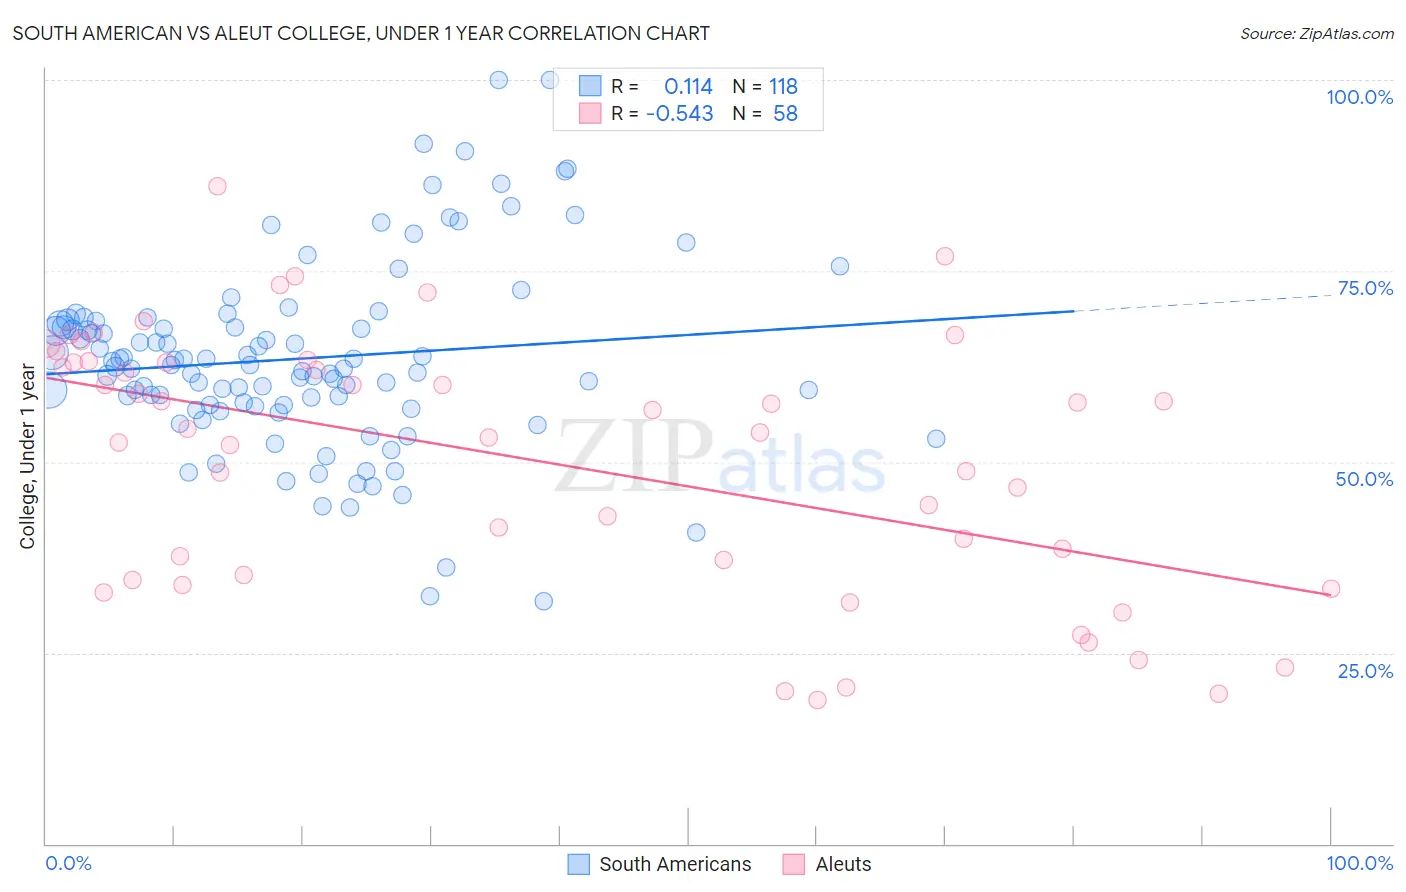
South American vs Aleut College, Under 1 year Correlation Chart
The statistical analysis conducted on geographies consisting of 494,173,553 people shows a poor positive correlation between the proportion of South Americans and percentage of population with at least college, under 1 year education in the United States with a correlation coefficient (R) of 0.114 and weighted average of 64.2%. Similarly, the statistical analysis conducted on geographies consisting of 61,782,940 people shows a substantial negative correlation between the proportion of Aleuts and percentage of population with at least college, under 1 year education in the United States with a correlation coefficient (R) of -0.543 and weighted average of 62.2%, a difference of 3.3%.
College, Under 1 year Correlation Summary
| Measurement | South American | Aleut |
| Minimum | 31.8% | 18.8% |
| Maximum | 100.0% | 86.1% |
| Range | 68.2% | 67.4% |
| Mean | 63.5% | 50.3% |
| Median | 62.6% | 54.1% |
| Interquartile 25% (IQ1) | 57.4% | 35.3% |
| Interquartile 75% (IQ3) | 68.1% | 63.1% |
| Interquartile Range (IQR) | 10.7% | 27.8% |
| Standard Deviation (Sample) | 12.3% | 16.9% |
| Standard Deviation (Population) | 12.3% | 16.7% |
Similar Demographics by College, Under 1 year
Demographics Similar to South Americans by College, Under 1 year
In terms of college, under 1 year, the demographic groups most similar to South Americans are French Canadian (64.2%, a difference of 0.010%), Nigerian (64.3%, a difference of 0.040%), Uruguayan (64.2%, a difference of 0.050%), Panamanian (64.3%, a difference of 0.070%), and Tsimshian (64.3%, a difference of 0.13%).
| Demographics | Rating | Rank | College, Under 1 year |
| Immigrants | South Eastern Asia | 22.1 /100 | #195 | Fair 64.5% |
| Tongans | 21.2 /100 | #196 | Fair 64.5% |
| Costa Ricans | 19.6 /100 | #197 | Poor 64.4% |
| Tsimshian | 17.9 /100 | #198 | Poor 64.3% |
| Panamanians | 17.0 /100 | #199 | Poor 64.3% |
| Nigerians | 16.7 /100 | #200 | Poor 64.3% |
| French Canadians | 16.3 /100 | #201 | Poor 64.2% |
| South Americans | 16.2 /100 | #202 | Poor 64.2% |
| Uruguayans | 15.6 /100 | #203 | Poor 64.2% |
| Immigrants | Zaire | 14.6 /100 | #204 | Poor 64.1% |
| Peruvians | 13.7 /100 | #205 | Poor 64.1% |
| Whites/Caucasians | 12.8 /100 | #206 | Poor 64.0% |
| Colombians | 12.4 /100 | #207 | Poor 64.0% |
| Immigrants | Vietnam | 12.1 /100 | #208 | Poor 64.0% |
| Puget Sound Salish | 11.3 /100 | #209 | Poor 63.9% |
Demographics Similar to Aleuts by College, Under 1 year
In terms of college, under 1 year, the demographic groups most similar to Aleuts are Nepalese (62.2%, a difference of 0.0%), Ottawa (62.2%, a difference of 0.010%), Malaysian (62.2%, a difference of 0.060%), Hawaiian (62.1%, a difference of 0.090%), and Colville (62.1%, a difference of 0.18%).
| Demographics | Rating | Rank | College, Under 1 year |
| Iroquois | 2.0 /100 | #233 | Tragic 62.6% |
| Chippewa | 2.0 /100 | #234 | Tragic 62.6% |
| Spanish Americans | 1.9 /100 | #235 | Tragic 62.6% |
| Immigrants | Immigrants | 1.7 /100 | #236 | Tragic 62.5% |
| Immigrants | Burma/Myanmar | 1.6 /100 | #237 | Tragic 62.5% |
| French American Indians | 1.5 /100 | #238 | Tragic 62.4% |
| Nepalese | 1.1 /100 | #239 | Tragic 62.2% |
| Aleuts | 1.1 /100 | #240 | Tragic 62.2% |
| Ottawa | 1.1 /100 | #241 | Tragic 62.2% |
| Malaysians | 1.1 /100 | #242 | Tragic 62.2% |
| Hawaiians | 1.1 /100 | #243 | Tragic 62.1% |
| Colville | 1.0 /100 | #244 | Tragic 62.1% |
| Delaware | 0.9 /100 | #245 | Tragic 62.1% |
| Marshallese | 0.8 /100 | #246 | Tragic 61.9% |
| Immigrants | Liberia | 0.8 /100 | #247 | Tragic 61.9% |