Dominican vs Romanian College, Under 1 year
COMPARE
Dominican
Romanian
College, Under 1 year
College, Under 1 year Comparison
Dominicans
Romanians
55.5%
COLLEGE, UNDER 1 YEAR
0.0/ 100
METRIC RATING
331st/ 347
METRIC RANK
68.2%
COLLEGE, UNDER 1 YEAR
97.9/ 100
METRIC RATING
93rd/ 347
METRIC RANK
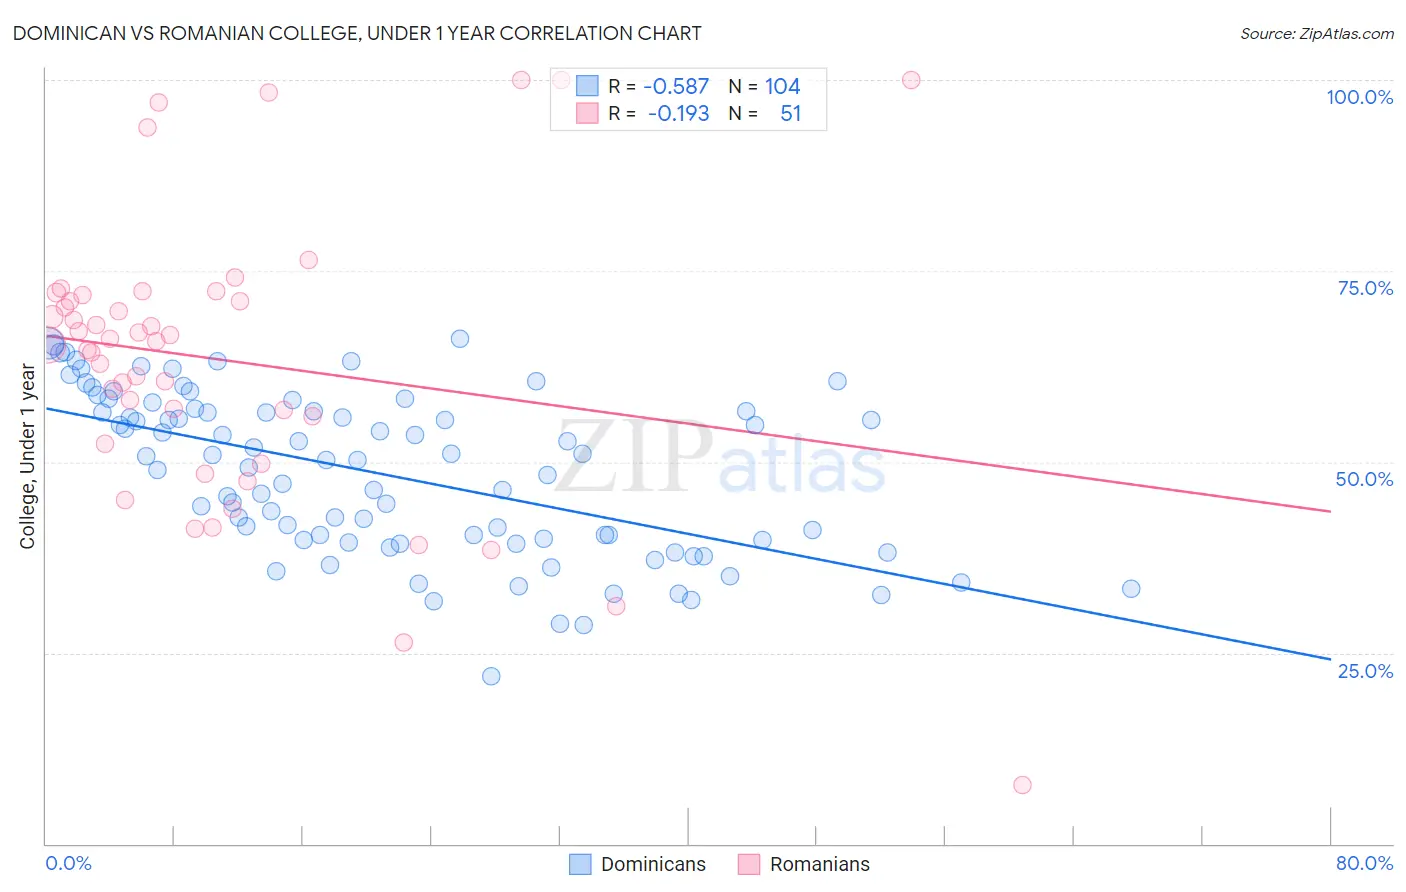
Dominican vs Romanian College, Under 1 year Correlation Chart
The statistical analysis conducted on geographies consisting of 355,140,552 people shows a substantial negative correlation between the proportion of Dominicans and percentage of population with at least college, under 1 year education in the United States with a correlation coefficient (R) of -0.587 and weighted average of 55.5%. Similarly, the statistical analysis conducted on geographies consisting of 377,903,335 people shows a poor negative correlation between the proportion of Romanians and percentage of population with at least college, under 1 year education in the United States with a correlation coefficient (R) of -0.193 and weighted average of 68.2%, a difference of 22.9%.
College, Under 1 year Correlation Summary
| Measurement | Dominican | Romanian |
| Minimum | 22.0% | 7.6% |
| Maximum | 66.2% | 100.0% |
| Range | 44.2% | 92.4% |
| Mean | 48.5% | 63.3% |
| Median | 50.2% | 65.8% |
| Interquartile 25% (IQ1) | 39.7% | 52.4% |
| Interquartile 75% (IQ3) | 56.6% | 71.8% |
| Interquartile Range (IQR) | 16.9% | 19.5% |
| Standard Deviation (Sample) | 10.5% | 18.8% |
| Standard Deviation (Population) | 10.4% | 18.7% |
Similar Demographics by College, Under 1 year
Demographics Similar to Dominicans by College, Under 1 year
In terms of college, under 1 year, the demographic groups most similar to Dominicans are Mexican (55.6%, a difference of 0.26%), Immigrants from Cuba (55.7%, a difference of 0.40%), Immigrants from Yemen (55.3%, a difference of 0.41%), Yuman (55.1%, a difference of 0.73%), and Cape Verdean (56.0%, a difference of 1.0%).
| Demographics | Rating | Rank | College, Under 1 year |
| Immigrants | El Salvador | 0.0 /100 | #324 | Tragic 56.4% |
| Immigrants | Latin America | 0.0 /100 | #325 | Tragic 56.3% |
| Navajo | 0.0 /100 | #326 | Tragic 56.3% |
| Immigrants | Guatemala | 0.0 /100 | #327 | Tragic 56.2% |
| Cape Verdeans | 0.0 /100 | #328 | Tragic 56.0% |
| Immigrants | Cuba | 0.0 /100 | #329 | Tragic 55.7% |
| Mexicans | 0.0 /100 | #330 | Tragic 55.6% |
| Dominicans | 0.0 /100 | #331 | Tragic 55.5% |
| Immigrants | Yemen | 0.0 /100 | #332 | Tragic 55.3% |
| Yuman | 0.0 /100 | #333 | Tragic 55.1% |
| Immigrants | Azores | 0.0 /100 | #334 | Tragic 54.7% |
| Inupiat | 0.0 /100 | #335 | Tragic 54.6% |
| Pennsylvania Germans | 0.0 /100 | #336 | Tragic 54.5% |
| Immigrants | Central America | 0.0 /100 | #337 | Tragic 54.4% |
| Lumbee | 0.0 /100 | #338 | Tragic 54.2% |
Demographics Similar to Romanians by College, Under 1 year
In terms of college, under 1 year, the demographic groups most similar to Romanians are Luxembourger (68.2%, a difference of 0.090%), Armenian (68.1%, a difference of 0.090%), European (68.2%, a difference of 0.10%), Icelander (68.3%, a difference of 0.13%), and Ethiopian (68.3%, a difference of 0.19%).
| Demographics | Rating | Rank | College, Under 1 year |
| Immigrants | Lebanon | 98.3 /100 | #86 | Exceptional 68.3% |
| Chinese | 98.3 /100 | #87 | Exceptional 68.3% |
| Croatians | 98.2 /100 | #88 | Exceptional 68.3% |
| Ethiopians | 98.2 /100 | #89 | Exceptional 68.3% |
| Icelanders | 98.1 /100 | #90 | Exceptional 68.3% |
| Europeans | 98.1 /100 | #91 | Exceptional 68.2% |
| Luxembourgers | 98.1 /100 | #92 | Exceptional 68.2% |
| Romanians | 97.9 /100 | #93 | Exceptional 68.2% |
| Armenians | 97.7 /100 | #94 | Exceptional 68.1% |
| Immigrants | Pakistan | 97.5 /100 | #95 | Exceptional 68.0% |
| Jordanians | 97.4 /100 | #96 | Exceptional 68.0% |
| Immigrants | Ethiopia | 97.3 /100 | #97 | Exceptional 68.0% |
| Paraguayans | 97.1 /100 | #98 | Exceptional 67.9% |
| Immigrants | Bolivia | 97.0 /100 | #99 | Exceptional 67.9% |
| Immigrants | Argentina | 97.0 /100 | #100 | Exceptional 67.9% |