Dominican vs Immigrants from Austria College, Under 1 year
COMPARE
Dominican
Immigrants from Austria
College, Under 1 year
College, Under 1 year Comparison
Dominicans
Immigrants from Austria
55.5%
COLLEGE, UNDER 1 YEAR
0.0/ 100
METRIC RATING
331st/ 347
METRIC RANK
70.0%
COLLEGE, UNDER 1 YEAR
99.8/ 100
METRIC RATING
49th/ 347
METRIC RANK
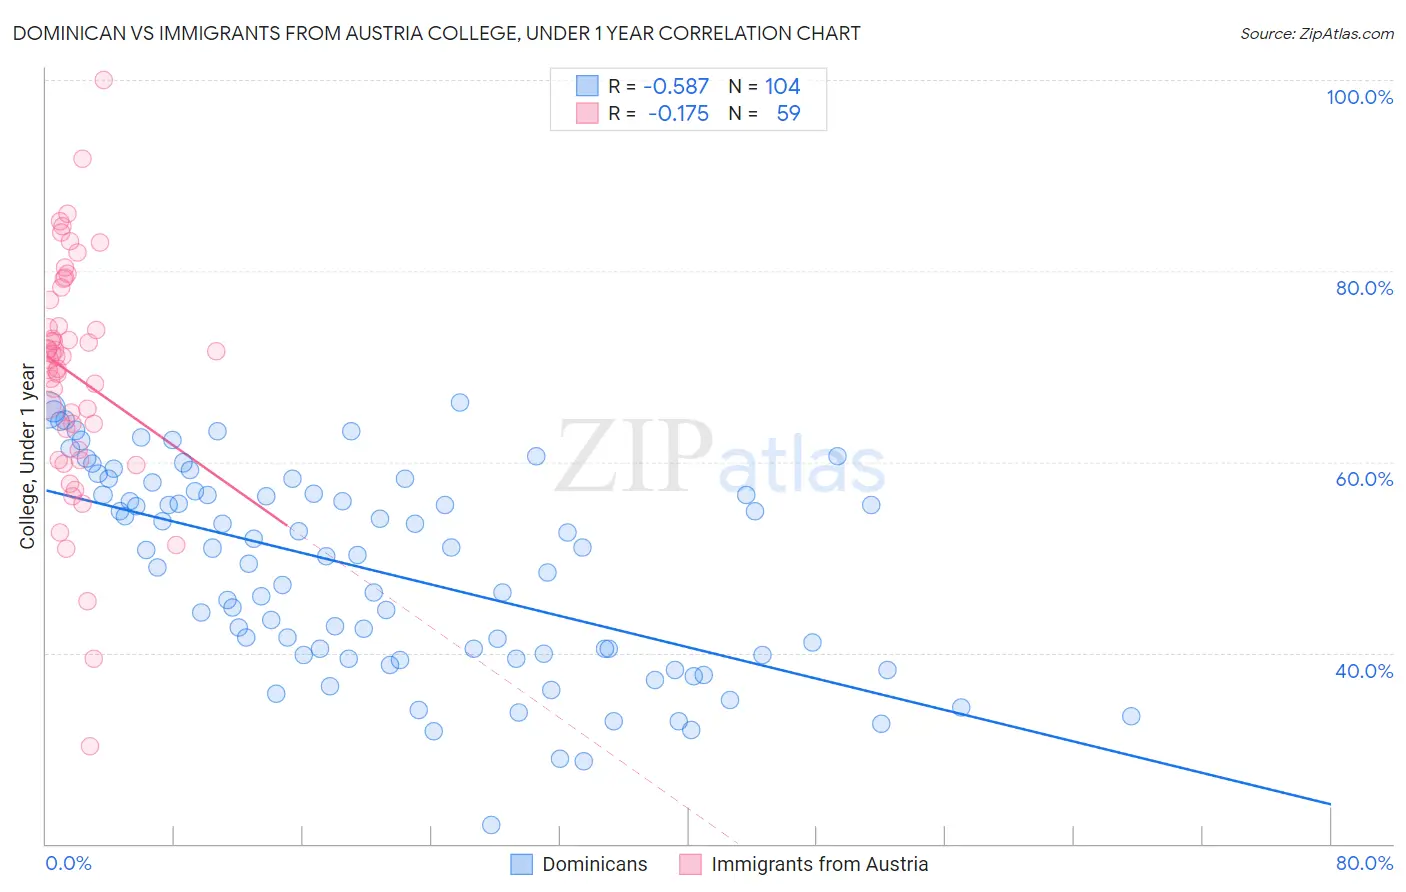
Dominican vs Immigrants from Austria College, Under 1 year Correlation Chart
The statistical analysis conducted on geographies consisting of 355,140,552 people shows a substantial negative correlation between the proportion of Dominicans and percentage of population with at least college, under 1 year education in the United States with a correlation coefficient (R) of -0.587 and weighted average of 55.5%. Similarly, the statistical analysis conducted on geographies consisting of 167,973,751 people shows a poor negative correlation between the proportion of Immigrants from Austria and percentage of population with at least college, under 1 year education in the United States with a correlation coefficient (R) of -0.175 and weighted average of 70.0%, a difference of 26.1%.
College, Under 1 year Correlation Summary
| Measurement | Dominican | Immigrants from Austria |
| Minimum | 22.0% | 30.2% |
| Maximum | 66.2% | 100.0% |
| Range | 44.2% | 69.8% |
| Mean | 48.5% | 69.1% |
| Median | 50.2% | 71.0% |
| Interquartile 25% (IQ1) | 39.7% | 61.2% |
| Interquartile 75% (IQ3) | 56.6% | 76.9% |
| Interquartile Range (IQR) | 16.9% | 15.7% |
| Standard Deviation (Sample) | 10.5% | 12.3% |
| Standard Deviation (Population) | 10.4% | 12.2% |
Similar Demographics by College, Under 1 year
Demographics Similar to Dominicans by College, Under 1 year
In terms of college, under 1 year, the demographic groups most similar to Dominicans are Mexican (55.6%, a difference of 0.26%), Immigrants from Cuba (55.7%, a difference of 0.40%), Immigrants from Yemen (55.3%, a difference of 0.41%), Yuman (55.1%, a difference of 0.73%), and Cape Verdean (56.0%, a difference of 1.0%).
| Demographics | Rating | Rank | College, Under 1 year |
| Immigrants | El Salvador | 0.0 /100 | #324 | Tragic 56.4% |
| Immigrants | Latin America | 0.0 /100 | #325 | Tragic 56.3% |
| Navajo | 0.0 /100 | #326 | Tragic 56.3% |
| Immigrants | Guatemala | 0.0 /100 | #327 | Tragic 56.2% |
| Cape Verdeans | 0.0 /100 | #328 | Tragic 56.0% |
| Immigrants | Cuba | 0.0 /100 | #329 | Tragic 55.7% |
| Mexicans | 0.0 /100 | #330 | Tragic 55.6% |
| Dominicans | 0.0 /100 | #331 | Tragic 55.5% |
| Immigrants | Yemen | 0.0 /100 | #332 | Tragic 55.3% |
| Yuman | 0.0 /100 | #333 | Tragic 55.1% |
| Immigrants | Azores | 0.0 /100 | #334 | Tragic 54.7% |
| Inupiat | 0.0 /100 | #335 | Tragic 54.6% |
| Pennsylvania Germans | 0.0 /100 | #336 | Tragic 54.5% |
| Immigrants | Central America | 0.0 /100 | #337 | Tragic 54.4% |
| Lumbee | 0.0 /100 | #338 | Tragic 54.2% |
Demographics Similar to Immigrants from Austria by College, Under 1 year
In terms of college, under 1 year, the demographic groups most similar to Immigrants from Austria are Immigrants from Netherlands (70.0%, a difference of 0.040%), Immigrants from Bulgaria (70.0%, a difference of 0.10%), Zimbabwean (69.9%, a difference of 0.12%), Mongolian (69.9%, a difference of 0.15%), and Immigrants from Russia (69.9%, a difference of 0.18%).
| Demographics | Rating | Rank | College, Under 1 year |
| Immigrants | Lithuania | 99.9 /100 | #42 | Exceptional 70.3% |
| Israelis | 99.9 /100 | #43 | Exceptional 70.2% |
| New Zealanders | 99.9 /100 | #44 | Exceptional 70.2% |
| Immigrants | Norway | 99.9 /100 | #45 | Exceptional 70.2% |
| Immigrants | Latvia | 99.9 /100 | #46 | Exceptional 70.1% |
| Immigrants | Bulgaria | 99.8 /100 | #47 | Exceptional 70.0% |
| Immigrants | Netherlands | 99.8 /100 | #48 | Exceptional 70.0% |
| Immigrants | Austria | 99.8 /100 | #49 | Exceptional 70.0% |
| Zimbabweans | 99.8 /100 | #50 | Exceptional 69.9% |
| Mongolians | 99.8 /100 | #51 | Exceptional 69.9% |
| Immigrants | Russia | 99.8 /100 | #52 | Exceptional 69.9% |
| South Africans | 99.7 /100 | #53 | Exceptional 69.7% |
| Immigrants | Czechoslovakia | 99.7 /100 | #54 | Exceptional 69.6% |
| Maltese | 99.7 /100 | #55 | Exceptional 69.5% |
| Immigrants | Scotland | 99.6 /100 | #56 | Exceptional 69.4% |