Dominican vs Immigrants from China College, Under 1 year
COMPARE
Dominican
Immigrants from China
College, Under 1 year
College, Under 1 year Comparison
Dominicans
Immigrants from China
55.5%
COLLEGE, UNDER 1 YEAR
0.0/ 100
METRIC RATING
331st/ 347
METRIC RANK
70.9%
COLLEGE, UNDER 1 YEAR
99.9/ 100
METRIC RATING
30th/ 347
METRIC RANK
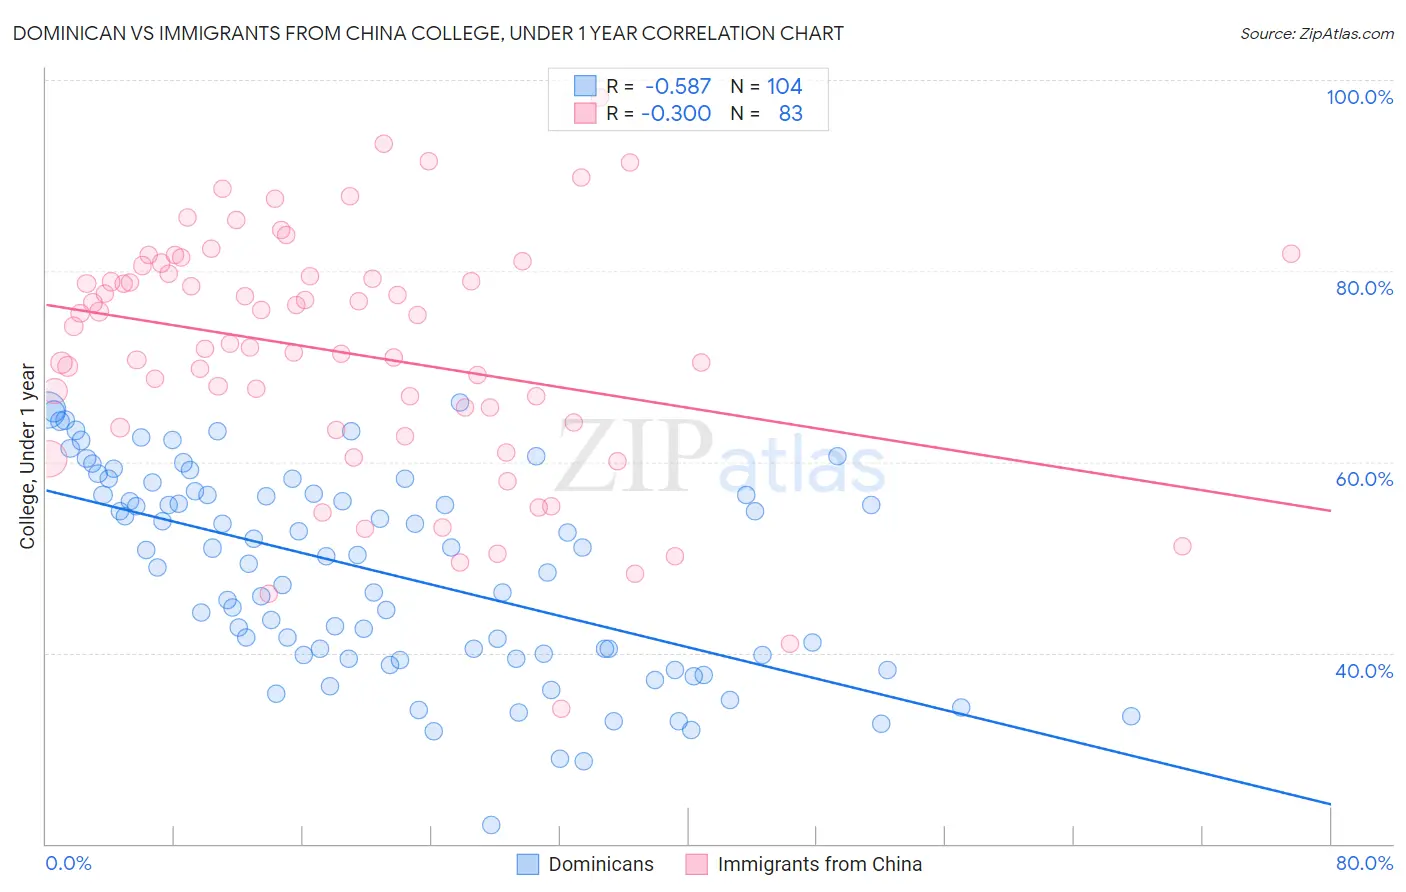
Dominican vs Immigrants from China College, Under 1 year Correlation Chart
The statistical analysis conducted on geographies consisting of 355,140,552 people shows a substantial negative correlation between the proportion of Dominicans and percentage of population with at least college, under 1 year education in the United States with a correlation coefficient (R) of -0.587 and weighted average of 55.5%. Similarly, the statistical analysis conducted on geographies consisting of 457,079,223 people shows a mild negative correlation between the proportion of Immigrants from China and percentage of population with at least college, under 1 year education in the United States with a correlation coefficient (R) of -0.300 and weighted average of 70.9%, a difference of 27.7%.
College, Under 1 year Correlation Summary
| Measurement | Dominican | Immigrants from China |
| Minimum | 22.0% | 34.2% |
| Maximum | 66.2% | 98.2% |
| Range | 44.2% | 64.0% |
| Mean | 48.5% | 71.4% |
| Median | 50.2% | 72.4% |
| Interquartile 25% (IQ1) | 39.7% | 63.6% |
| Interquartile 75% (IQ3) | 56.6% | 79.7% |
| Interquartile Range (IQR) | 16.9% | 16.1% |
| Standard Deviation (Sample) | 10.5% | 12.8% |
| Standard Deviation (Population) | 10.4% | 12.7% |
Similar Demographics by College, Under 1 year
Demographics Similar to Dominicans by College, Under 1 year
In terms of college, under 1 year, the demographic groups most similar to Dominicans are Mexican (55.6%, a difference of 0.26%), Immigrants from Cuba (55.7%, a difference of 0.40%), Immigrants from Yemen (55.3%, a difference of 0.41%), Yuman (55.1%, a difference of 0.73%), and Cape Verdean (56.0%, a difference of 1.0%).
| Demographics | Rating | Rank | College, Under 1 year |
| Immigrants | El Salvador | 0.0 /100 | #324 | Tragic 56.4% |
| Immigrants | Latin America | 0.0 /100 | #325 | Tragic 56.3% |
| Navajo | 0.0 /100 | #326 | Tragic 56.3% |
| Immigrants | Guatemala | 0.0 /100 | #327 | Tragic 56.2% |
| Cape Verdeans | 0.0 /100 | #328 | Tragic 56.0% |
| Immigrants | Cuba | 0.0 /100 | #329 | Tragic 55.7% |
| Mexicans | 0.0 /100 | #330 | Tragic 55.6% |
| Dominicans | 0.0 /100 | #331 | Tragic 55.5% |
| Immigrants | Yemen | 0.0 /100 | #332 | Tragic 55.3% |
| Yuman | 0.0 /100 | #333 | Tragic 55.1% |
| Immigrants | Azores | 0.0 /100 | #334 | Tragic 54.7% |
| Inupiat | 0.0 /100 | #335 | Tragic 54.6% |
| Pennsylvania Germans | 0.0 /100 | #336 | Tragic 54.5% |
| Immigrants | Central America | 0.0 /100 | #337 | Tragic 54.4% |
| Lumbee | 0.0 /100 | #338 | Tragic 54.2% |
Demographics Similar to Immigrants from China by College, Under 1 year
In terms of college, under 1 year, the demographic groups most similar to Immigrants from China are Indian (Asian) (70.8%, a difference of 0.11%), Immigrants from Hong Kong (71.0%, a difference of 0.18%), Immigrants from France (71.0%, a difference of 0.18%), Turkish (70.7%, a difference of 0.19%), and Immigrants from Ireland (71.0%, a difference of 0.21%).
| Demographics | Rating | Rank | College, Under 1 year |
| Immigrants | Northern Europe | 100.0 /100 | #23 | Exceptional 71.1% |
| Soviet Union | 100.0 /100 | #24 | Exceptional 71.1% |
| Bulgarians | 100.0 /100 | #25 | Exceptional 71.1% |
| Immigrants | Denmark | 100.0 /100 | #26 | Exceptional 71.0% |
| Immigrants | Ireland | 100.0 /100 | #27 | Exceptional 71.0% |
| Immigrants | Hong Kong | 100.0 /100 | #28 | Exceptional 71.0% |
| Immigrants | France | 100.0 /100 | #29 | Exceptional 71.0% |
| Immigrants | China | 99.9 /100 | #30 | Exceptional 70.9% |
| Indians (Asian) | 99.9 /100 | #31 | Exceptional 70.8% |
| Turks | 99.9 /100 | #32 | Exceptional 70.7% |
| Immigrants | South Africa | 99.9 /100 | #33 | Exceptional 70.6% |
| Estonians | 99.9 /100 | #34 | Exceptional 70.6% |
| Russians | 99.9 /100 | #35 | Exceptional 70.5% |
| Immigrants | Sri Lanka | 99.9 /100 | #36 | Exceptional 70.5% |
| Immigrants | Saudi Arabia | 99.9 /100 | #37 | Exceptional 70.4% |