Czech vs Immigrants from Uganda College, Under 1 year
COMPARE
Czech
Immigrants from Uganda
College, Under 1 year
College, Under 1 year Comparison
Czechs
Immigrants from Uganda
67.1%
COLLEGE, UNDER 1 YEAR
90.8/ 100
METRIC RATING
127th/ 347
METRIC RANK
66.5%
COLLEGE, UNDER 1 YEAR
82.8/ 100
METRIC RATING
143rd/ 347
METRIC RANK
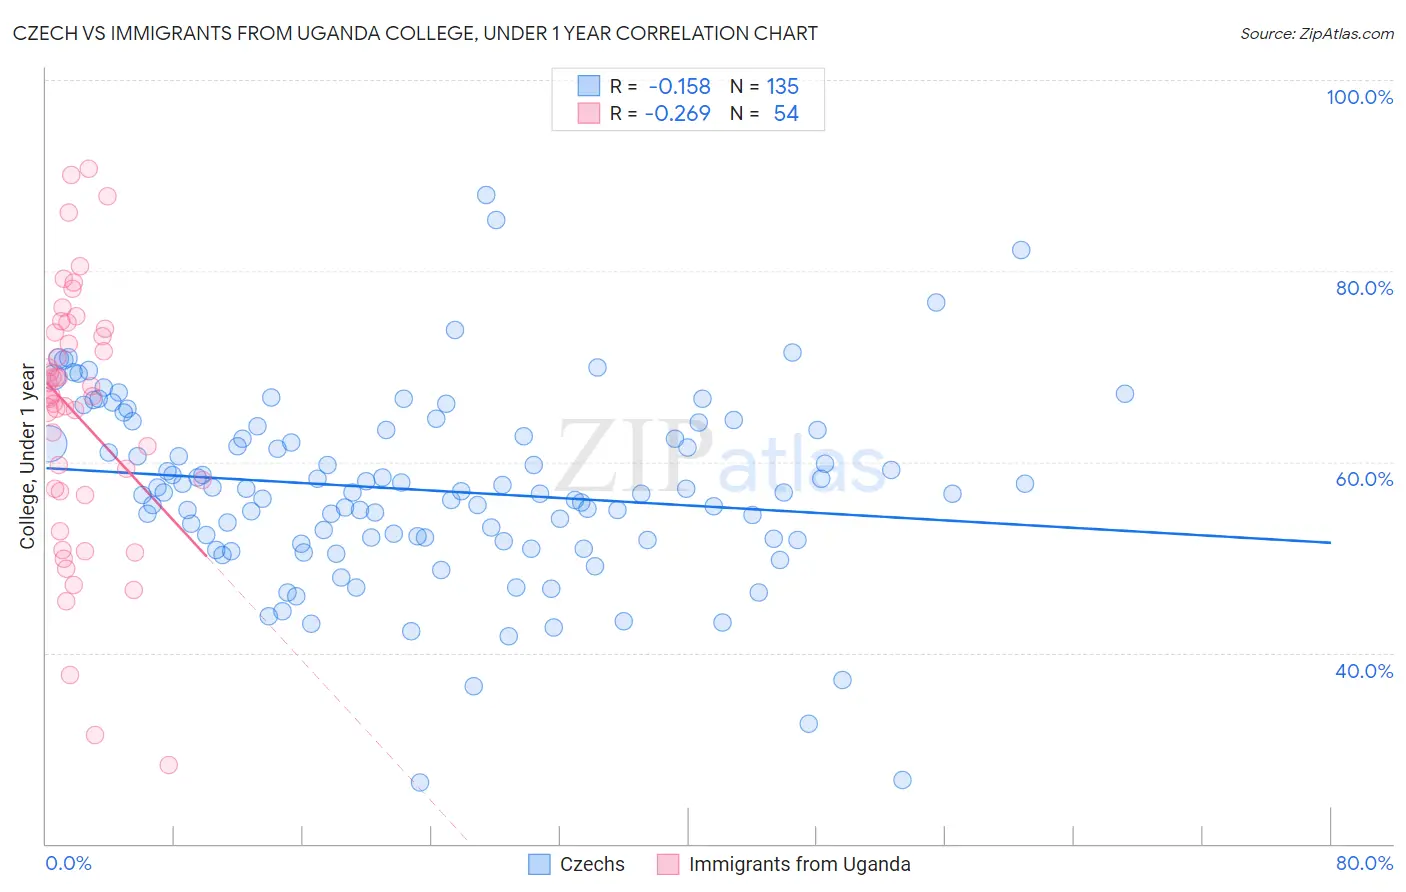
Czech vs Immigrants from Uganda College, Under 1 year Correlation Chart
The statistical analysis conducted on geographies consisting of 484,811,480 people shows a poor negative correlation between the proportion of Czechs and percentage of population with at least college, under 1 year education in the United States with a correlation coefficient (R) of -0.158 and weighted average of 67.1%. Similarly, the statistical analysis conducted on geographies consisting of 125,982,535 people shows a weak negative correlation between the proportion of Immigrants from Uganda and percentage of population with at least college, under 1 year education in the United States with a correlation coefficient (R) of -0.269 and weighted average of 66.5%, a difference of 0.78%.
College, Under 1 year Correlation Summary
| Measurement | Czech | Immigrants from Uganda |
| Minimum | 26.5% | 28.3% |
| Maximum | 88.0% | 90.7% |
| Range | 61.5% | 62.4% |
| Mean | 57.1% | 64.8% |
| Median | 56.8% | 66.8% |
| Interquartile 25% (IQ1) | 51.8% | 57.0% |
| Interquartile 75% (IQ3) | 63.3% | 73.5% |
| Interquartile Range (IQR) | 11.5% | 16.6% |
| Standard Deviation (Sample) | 9.8% | 13.6% |
| Standard Deviation (Population) | 9.8% | 13.5% |
Demographics Similar to Czechs and Immigrants from Uganda by College, Under 1 year
In terms of college, under 1 year, the demographic groups most similar to Czechs are Scottish (67.0%, a difference of 0.070%), Alsatian (67.1%, a difference of 0.080%), Italian (67.2%, a difference of 0.14%), Immigrants from Eastern Africa (67.0%, a difference of 0.15%), and Immigrants from Syria (66.9%, a difference of 0.21%). Similarly, the demographic groups most similar to Immigrants from Uganda are English (66.6%, a difference of 0.010%), Immigrants from Germany (66.5%, a difference of 0.060%), Immigrants from Kenya (66.5%, a difference of 0.070%), Immigrants from Afghanistan (66.7%, a difference of 0.19%), and Slavic (66.7%, a difference of 0.25%).
| Demographics | Rating | Rank | College, Under 1 year |
| Italians | 91.8 /100 | #125 | Exceptional 67.2% |
| Alsatians | 91.3 /100 | #126 | Exceptional 67.1% |
| Czechs | 90.8 /100 | #127 | Exceptional 67.1% |
| Scottish | 90.2 /100 | #128 | Exceptional 67.0% |
| Immigrants | Eastern Africa | 89.5 /100 | #129 | Excellent 67.0% |
| Immigrants | Syria | 89.0 /100 | #130 | Excellent 66.9% |
| Finns | 88.6 /100 | #131 | Excellent 66.9% |
| Poles | 88.4 /100 | #132 | Excellent 66.9% |
| Immigrants | Brazil | 88.3 /100 | #133 | Excellent 66.9% |
| Iraqis | 88.0 /100 | #134 | Excellent 66.8% |
| Canadians | 87.9 /100 | #135 | Excellent 66.8% |
| Ugandans | 87.8 /100 | #136 | Excellent 66.8% |
| Immigrants | Chile | 87.4 /100 | #137 | Excellent 66.8% |
| Immigrants | Italy | 86.9 /100 | #138 | Excellent 66.8% |
| Venezuelans | 85.9 /100 | #139 | Excellent 66.7% |
| Slavs | 85.9 /100 | #140 | Excellent 66.7% |
| Immigrants | Afghanistan | 85.1 /100 | #141 | Excellent 66.7% |
| English | 82.9 /100 | #142 | Excellent 66.6% |
| Immigrants | Uganda | 82.8 /100 | #143 | Excellent 66.5% |
| Immigrants | Germany | 82.0 /100 | #144 | Excellent 66.5% |
| Immigrants | Kenya | 81.8 /100 | #145 | Excellent 66.5% |