Czech vs Immigrants from Kuwait College, Under 1 year
COMPARE
Czech
Immigrants from Kuwait
College, Under 1 year
College, Under 1 year Comparison
Czechs
Immigrants from Kuwait
67.1%
COLLEGE, UNDER 1 YEAR
90.8/ 100
METRIC RATING
127th/ 347
METRIC RANK
70.3%
COLLEGE, UNDER 1 YEAR
99.9/ 100
METRIC RATING
41st/ 347
METRIC RANK
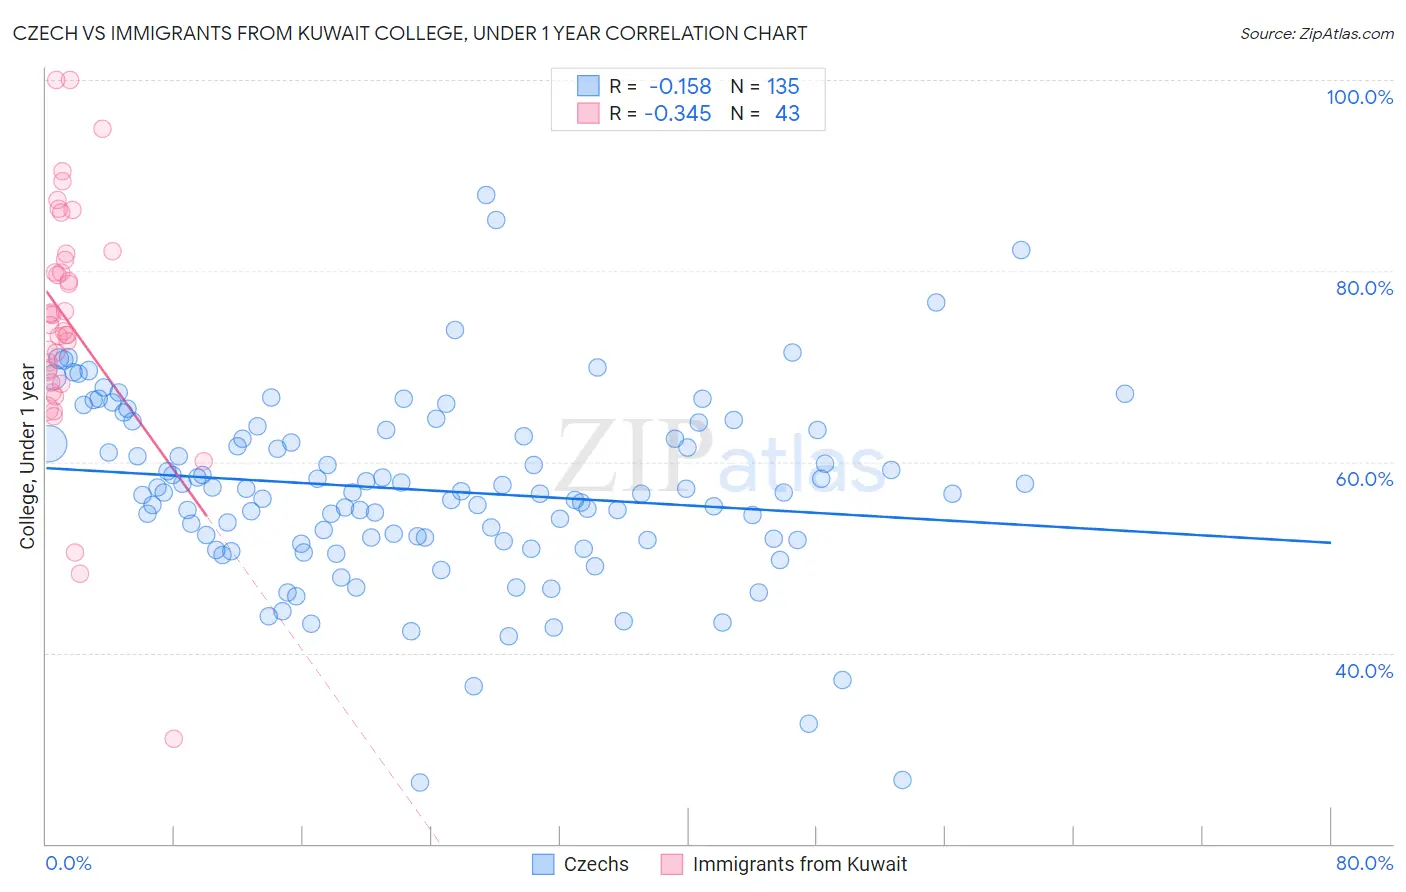
Czech vs Immigrants from Kuwait College, Under 1 year Correlation Chart
The statistical analysis conducted on geographies consisting of 484,811,480 people shows a poor negative correlation between the proportion of Czechs and percentage of population with at least college, under 1 year education in the United States with a correlation coefficient (R) of -0.158 and weighted average of 67.1%. Similarly, the statistical analysis conducted on geographies consisting of 136,917,085 people shows a mild negative correlation between the proportion of Immigrants from Kuwait and percentage of population with at least college, under 1 year education in the United States with a correlation coefficient (R) of -0.345 and weighted average of 70.3%, a difference of 4.8%.
College, Under 1 year Correlation Summary
| Measurement | Czech | Immigrants from Kuwait |
| Minimum | 26.5% | 31.0% |
| Maximum | 88.0% | 100.0% |
| Range | 61.5% | 69.0% |
| Mean | 57.1% | 74.8% |
| Median | 56.8% | 74.3% |
| Interquartile 25% (IQ1) | 51.8% | 68.3% |
| Interquartile 75% (IQ3) | 63.3% | 81.8% |
| Interquartile Range (IQR) | 11.5% | 13.5% |
| Standard Deviation (Sample) | 9.8% | 12.9% |
| Standard Deviation (Population) | 9.8% | 12.7% |
Similar Demographics by College, Under 1 year
Demographics Similar to Czechs by College, Under 1 year
In terms of college, under 1 year, the demographic groups most similar to Czechs are Scottish (67.0%, a difference of 0.070%), Alsatian (67.1%, a difference of 0.080%), Italian (67.2%, a difference of 0.14%), Immigrants from Eastern Africa (67.0%, a difference of 0.15%), and Immigrants from Syria (66.9%, a difference of 0.21%).
| Demographics | Rating | Rank | College, Under 1 year |
| Serbians | 93.9 /100 | #120 | Exceptional 67.4% |
| Slovenes | 93.3 /100 | #121 | Exceptional 67.3% |
| Immigrants | Jordan | 92.8 /100 | #122 | Exceptional 67.3% |
| Immigrants | Northern Africa | 92.7 /100 | #123 | Exceptional 67.2% |
| Arabs | 92.6 /100 | #124 | Exceptional 67.2% |
| Italians | 91.8 /100 | #125 | Exceptional 67.2% |
| Alsatians | 91.3 /100 | #126 | Exceptional 67.1% |
| Czechs | 90.8 /100 | #127 | Exceptional 67.1% |
| Scottish | 90.2 /100 | #128 | Exceptional 67.0% |
| Immigrants | Eastern Africa | 89.5 /100 | #129 | Excellent 67.0% |
| Immigrants | Syria | 89.0 /100 | #130 | Excellent 66.9% |
| Finns | 88.6 /100 | #131 | Excellent 66.9% |
| Poles | 88.4 /100 | #132 | Excellent 66.9% |
| Immigrants | Brazil | 88.3 /100 | #133 | Excellent 66.9% |
| Iraqis | 88.0 /100 | #134 | Excellent 66.8% |
Demographics Similar to Immigrants from Kuwait by College, Under 1 year
In terms of college, under 1 year, the demographic groups most similar to Immigrants from Kuwait are Immigrants from Turkey (70.3%, a difference of 0.040%), Bhutanese (70.3%, a difference of 0.050%), Immigrants from Lithuania (70.3%, a difference of 0.050%), Australian (70.4%, a difference of 0.070%), and Israeli (70.2%, a difference of 0.11%).
| Demographics | Rating | Rank | College, Under 1 year |
| Estonians | 99.9 /100 | #34 | Exceptional 70.6% |
| Russians | 99.9 /100 | #35 | Exceptional 70.5% |
| Immigrants | Sri Lanka | 99.9 /100 | #36 | Exceptional 70.5% |
| Immigrants | Saudi Arabia | 99.9 /100 | #37 | Exceptional 70.4% |
| Australians | 99.9 /100 | #38 | Exceptional 70.4% |
| Bhutanese | 99.9 /100 | #39 | Exceptional 70.3% |
| Immigrants | Turkey | 99.9 /100 | #40 | Exceptional 70.3% |
| Immigrants | Kuwait | 99.9 /100 | #41 | Exceptional 70.3% |
| Immigrants | Lithuania | 99.9 /100 | #42 | Exceptional 70.3% |
| Israelis | 99.9 /100 | #43 | Exceptional 70.2% |
| New Zealanders | 99.9 /100 | #44 | Exceptional 70.2% |
| Immigrants | Norway | 99.9 /100 | #45 | Exceptional 70.2% |
| Immigrants | Latvia | 99.9 /100 | #46 | Exceptional 70.1% |
| Immigrants | Bulgaria | 99.8 /100 | #47 | Exceptional 70.0% |
| Immigrants | Netherlands | 99.8 /100 | #48 | Exceptional 70.0% |