Czech vs Immigrants from Sudan College, Under 1 year
COMPARE
Czech
Immigrants from Sudan
College, Under 1 year
College, Under 1 year Comparison
Czechs
Immigrants from Sudan
67.1%
COLLEGE, UNDER 1 YEAR
90.8/ 100
METRIC RATING
127th/ 347
METRIC RANK
66.2%
COLLEGE, UNDER 1 YEAR
76.0/ 100
METRIC RATING
151st/ 347
METRIC RANK
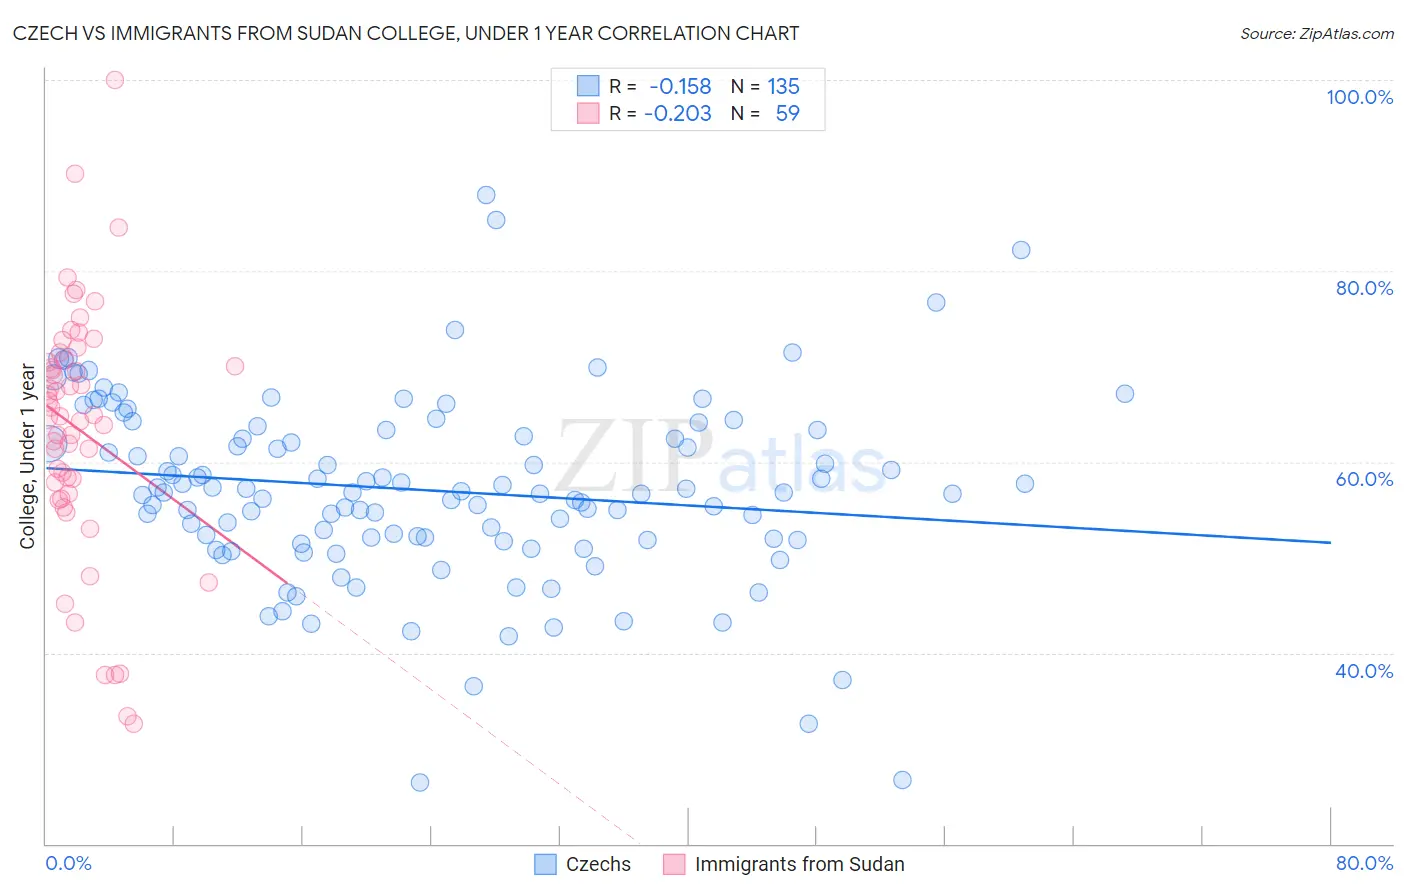
Czech vs Immigrants from Sudan College, Under 1 year Correlation Chart
The statistical analysis conducted on geographies consisting of 484,811,480 people shows a poor negative correlation between the proportion of Czechs and percentage of population with at least college, under 1 year education in the United States with a correlation coefficient (R) of -0.158 and weighted average of 67.1%. Similarly, the statistical analysis conducted on geographies consisting of 118,973,526 people shows a weak negative correlation between the proportion of Immigrants from Sudan and percentage of population with at least college, under 1 year education in the United States with a correlation coefficient (R) of -0.203 and weighted average of 66.2%, a difference of 1.2%.
College, Under 1 year Correlation Summary
| Measurement | Czech | Immigrants from Sudan |
| Minimum | 26.5% | 32.5% |
| Maximum | 88.0% | 100.0% |
| Range | 61.5% | 67.5% |
| Mean | 57.1% | 63.4% |
| Median | 56.8% | 64.8% |
| Interquartile 25% (IQ1) | 51.8% | 56.6% |
| Interquartile 75% (IQ3) | 63.3% | 70.7% |
| Interquartile Range (IQR) | 11.5% | 14.1% |
| Standard Deviation (Sample) | 9.8% | 13.2% |
| Standard Deviation (Population) | 9.8% | 13.0% |
Similar Demographics by College, Under 1 year
Demographics Similar to Czechs by College, Under 1 year
In terms of college, under 1 year, the demographic groups most similar to Czechs are Scottish (67.0%, a difference of 0.070%), Alsatian (67.1%, a difference of 0.080%), Italian (67.2%, a difference of 0.14%), Immigrants from Eastern Africa (67.0%, a difference of 0.15%), and Immigrants from Syria (66.9%, a difference of 0.21%).
| Demographics | Rating | Rank | College, Under 1 year |
| Serbians | 93.9 /100 | #120 | Exceptional 67.4% |
| Slovenes | 93.3 /100 | #121 | Exceptional 67.3% |
| Immigrants | Jordan | 92.8 /100 | #122 | Exceptional 67.3% |
| Immigrants | Northern Africa | 92.7 /100 | #123 | Exceptional 67.2% |
| Arabs | 92.6 /100 | #124 | Exceptional 67.2% |
| Italians | 91.8 /100 | #125 | Exceptional 67.2% |
| Alsatians | 91.3 /100 | #126 | Exceptional 67.1% |
| Czechs | 90.8 /100 | #127 | Exceptional 67.1% |
| Scottish | 90.2 /100 | #128 | Exceptional 67.0% |
| Immigrants | Eastern Africa | 89.5 /100 | #129 | Excellent 67.0% |
| Immigrants | Syria | 89.0 /100 | #130 | Excellent 66.9% |
| Finns | 88.6 /100 | #131 | Excellent 66.9% |
| Poles | 88.4 /100 | #132 | Excellent 66.9% |
| Immigrants | Brazil | 88.3 /100 | #133 | Excellent 66.9% |
| Iraqis | 88.0 /100 | #134 | Excellent 66.8% |
Demographics Similar to Immigrants from Sudan by College, Under 1 year
In terms of college, under 1 year, the demographic groups most similar to Immigrants from Sudan are Immigrants from Iraq (66.3%, a difference of 0.070%), Sudanese (66.2%, a difference of 0.11%), Immigrants from Venezuela (66.3%, a difference of 0.12%), Belgian (66.2%, a difference of 0.13%), and Taiwanese (66.4%, a difference of 0.16%).
| Demographics | Rating | Rank | College, Under 1 year |
| Immigrants | Germany | 82.0 /100 | #144 | Excellent 66.5% |
| Immigrants | Kenya | 81.8 /100 | #145 | Excellent 66.5% |
| Kenyans | 81.7 /100 | #146 | Excellent 66.5% |
| Immigrants | Morocco | 81.7 /100 | #147 | Excellent 66.5% |
| Taiwanese | 78.6 /100 | #148 | Good 66.4% |
| Immigrants | Venezuela | 77.9 /100 | #149 | Good 66.3% |
| Immigrants | Iraq | 77.1 /100 | #150 | Good 66.3% |
| Immigrants | Sudan | 76.0 /100 | #151 | Good 66.2% |
| Sudanese | 74.1 /100 | #152 | Good 66.2% |
| Belgians | 73.7 /100 | #153 | Good 66.2% |
| Immigrants | Eritrea | 71.9 /100 | #154 | Good 66.1% |
| Irish | 70.3 /100 | #155 | Good 66.0% |
| Welsh | 69.9 /100 | #156 | Good 66.0% |
| Sierra Leoneans | 67.8 /100 | #157 | Good 66.0% |
| Celtics | 67.3 /100 | #158 | Good 65.9% |