Canadian vs Belizean College, Under 1 year
COMPARE
Canadian
Belizean
College, Under 1 year
College, Under 1 year Comparison
Canadians
Belizeans
66.8%
COLLEGE, UNDER 1 YEAR
87.9/ 100
METRIC RATING
135th/ 347
METRIC RANK
60.1%
COLLEGE, UNDER 1 YEAR
0.1/ 100
METRIC RATING
282nd/ 347
METRIC RANK
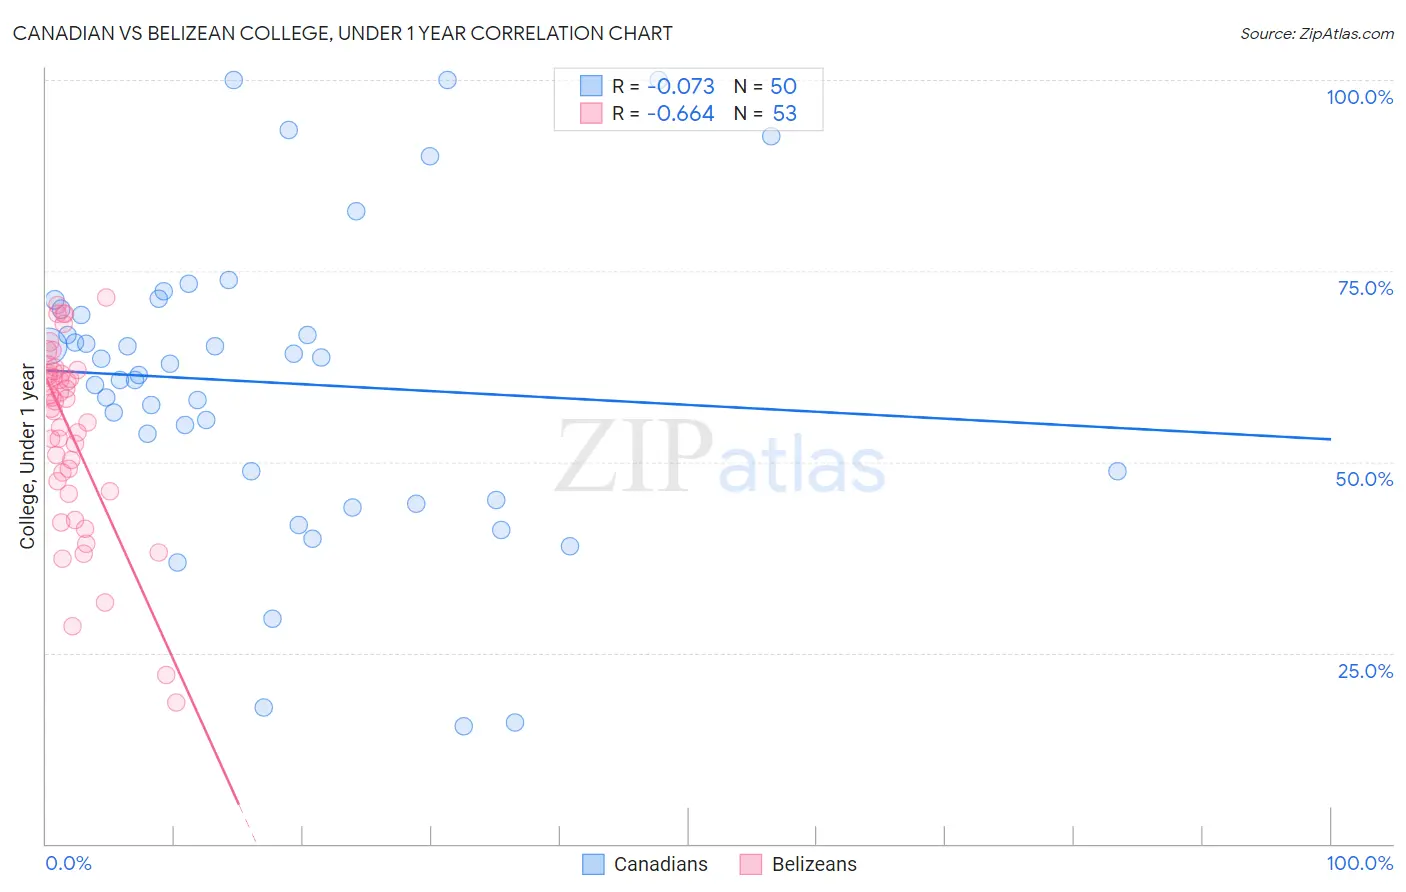
Canadian vs Belizean College, Under 1 year Correlation Chart
The statistical analysis conducted on geographies consisting of 437,553,139 people shows a slight negative correlation between the proportion of Canadians and percentage of population with at least college, under 1 year education in the United States with a correlation coefficient (R) of -0.073 and weighted average of 66.8%. Similarly, the statistical analysis conducted on geographies consisting of 144,224,111 people shows a significant negative correlation between the proportion of Belizeans and percentage of population with at least college, under 1 year education in the United States with a correlation coefficient (R) of -0.664 and weighted average of 60.1%, a difference of 11.3%.
College, Under 1 year Correlation Summary
| Measurement | Canadian | Belizean |
| Minimum | 15.4% | 18.5% |
| Maximum | 100.0% | 71.6% |
| Range | 84.6% | 53.1% |
| Mean | 60.4% | 53.9% |
| Median | 62.1% | 58.0% |
| Interquartile 25% (IQ1) | 48.8% | 46.8% |
| Interquartile 75% (IQ3) | 70.0% | 61.7% |
| Interquartile Range (IQR) | 21.2% | 14.9% |
| Standard Deviation (Sample) | 19.9% | 12.2% |
| Standard Deviation (Population) | 19.7% | 12.1% |
Similar Demographics by College, Under 1 year
Demographics Similar to Canadians by College, Under 1 year
In terms of college, under 1 year, the demographic groups most similar to Canadians are Iraqi (66.8%, a difference of 0.010%), Ugandan (66.8%, a difference of 0.010%), Immigrants from Brazil (66.9%, a difference of 0.040%), Immigrants from Chile (66.8%, a difference of 0.050%), and Polish (66.9%, a difference of 0.060%).
| Demographics | Rating | Rank | College, Under 1 year |
| Scottish | 90.2 /100 | #128 | Exceptional 67.0% |
| Immigrants | Eastern Africa | 89.5 /100 | #129 | Excellent 67.0% |
| Immigrants | Syria | 89.0 /100 | #130 | Excellent 66.9% |
| Finns | 88.6 /100 | #131 | Excellent 66.9% |
| Poles | 88.4 /100 | #132 | Excellent 66.9% |
| Immigrants | Brazil | 88.3 /100 | #133 | Excellent 66.9% |
| Iraqis | 88.0 /100 | #134 | Excellent 66.8% |
| Canadians | 87.9 /100 | #135 | Excellent 66.8% |
| Ugandans | 87.8 /100 | #136 | Excellent 66.8% |
| Immigrants | Chile | 87.4 /100 | #137 | Excellent 66.8% |
| Immigrants | Italy | 86.9 /100 | #138 | Excellent 66.8% |
| Venezuelans | 85.9 /100 | #139 | Excellent 66.7% |
| Slavs | 85.9 /100 | #140 | Excellent 66.7% |
| Immigrants | Afghanistan | 85.1 /100 | #141 | Excellent 66.7% |
| English | 82.9 /100 | #142 | Excellent 66.6% |
Demographics Similar to Belizeans by College, Under 1 year
In terms of college, under 1 year, the demographic groups most similar to Belizeans are Cherokee (60.1%, a difference of 0.040%), Crow (60.2%, a difference of 0.16%), Ute (60.2%, a difference of 0.25%), Yaqui (60.2%, a difference of 0.26%), and Bahamian (60.3%, a difference of 0.29%).
| Demographics | Rating | Rank | College, Under 1 year |
| Immigrants | Barbados | 0.1 /100 | #275 | Tragic 60.4% |
| Arapaho | 0.1 /100 | #276 | Tragic 60.3% |
| Bahamians | 0.1 /100 | #277 | Tragic 60.3% |
| Yaqui | 0.1 /100 | #278 | Tragic 60.2% |
| Ute | 0.1 /100 | #279 | Tragic 60.2% |
| Crow | 0.1 /100 | #280 | Tragic 60.2% |
| Cherokee | 0.1 /100 | #281 | Tragic 60.1% |
| Belizeans | 0.1 /100 | #282 | Tragic 60.1% |
| Immigrants | Jamaica | 0.0 /100 | #283 | Tragic 59.7% |
| Immigrants | St. Vincent and the Grenadines | 0.0 /100 | #284 | Tragic 59.6% |
| Paiute | 0.0 /100 | #285 | Tragic 59.6% |
| British West Indians | 0.0 /100 | #286 | Tragic 59.5% |
| Sioux | 0.0 /100 | #287 | Tragic 59.4% |
| Blacks/African Americans | 0.0 /100 | #288 | Tragic 59.4% |
| Choctaw | 0.0 /100 | #289 | Tragic 59.3% |