Moroccan vs Immigrants from Grenada Female Disability
COMPARE
Moroccan
Immigrants from Grenada
Female Disability
Female Disability Comparison
Moroccans
Immigrants from Grenada
12.1%
FEMALE DISABILITY
72.9/ 100
METRIC RATING
156th/ 347
METRIC RANK
12.4%
FEMALE DISABILITY
20.5/ 100
METRIC RATING
205th/ 347
METRIC RANK
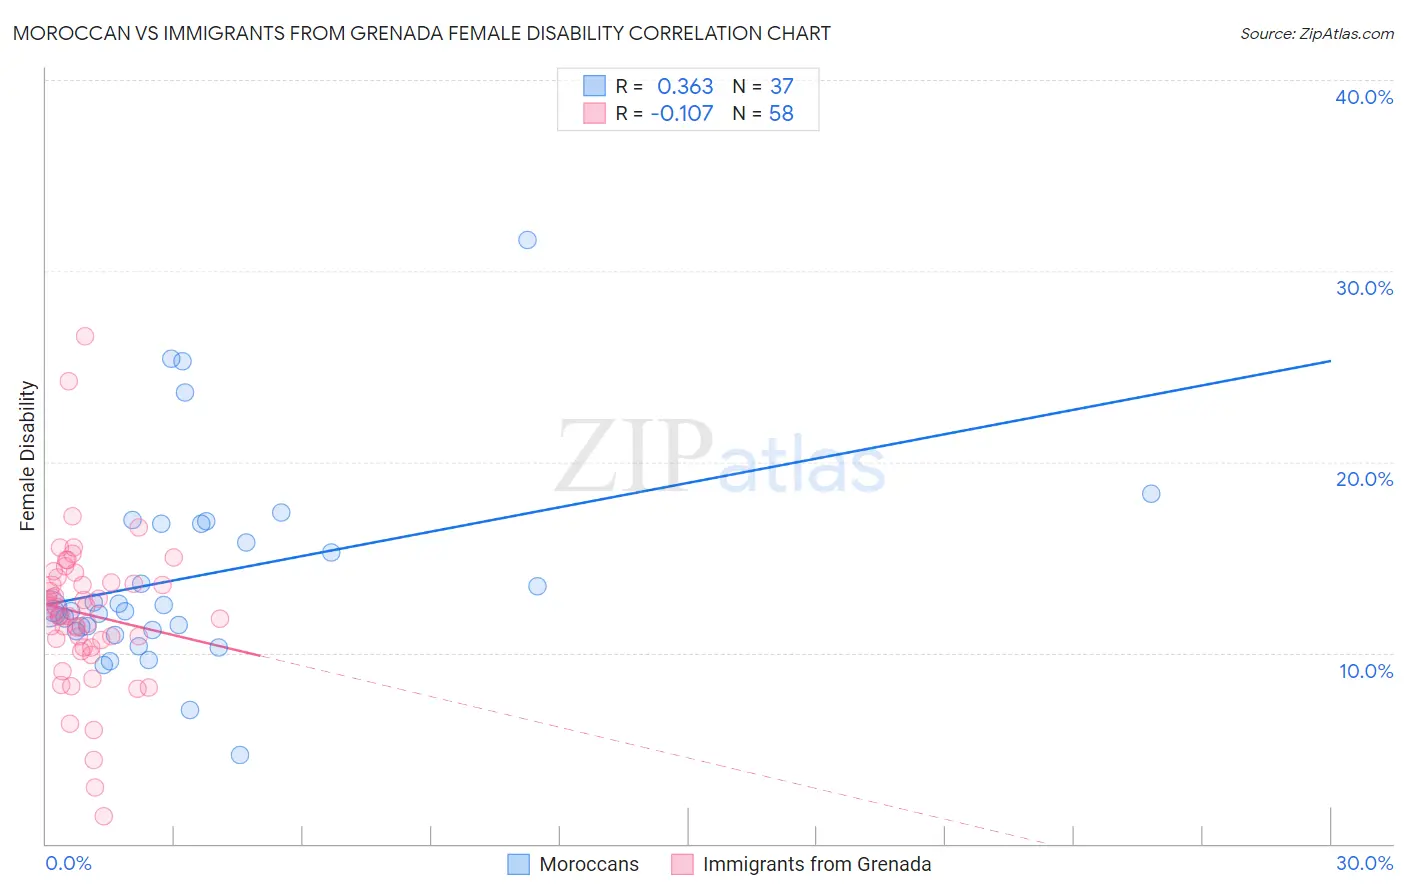
Moroccan vs Immigrants from Grenada Female Disability Correlation Chart
The statistical analysis conducted on geographies consisting of 201,802,269 people shows a mild positive correlation between the proportion of Moroccans and percentage of females with a disability in the United States with a correlation coefficient (R) of 0.363 and weighted average of 12.1%. Similarly, the statistical analysis conducted on geographies consisting of 67,188,961 people shows a poor negative correlation between the proportion of Immigrants from Grenada and percentage of females with a disability in the United States with a correlation coefficient (R) of -0.107 and weighted average of 12.4%, a difference of 2.2%.
Female Disability Correlation Summary
| Measurement | Moroccan | Immigrants from Grenada |
| Minimum | 4.6% | 1.4% |
| Maximum | 31.6% | 26.6% |
| Range | 27.0% | 25.2% |
| Mean | 14.0% | 12.0% |
| Median | 12.2% | 12.2% |
| Interquartile 25% (IQ1) | 11.2% | 10.3% |
| Interquartile 75% (IQ3) | 16.8% | 13.7% |
| Interquartile Range (IQR) | 5.6% | 3.4% |
| Standard Deviation (Sample) | 5.3% | 4.0% |
| Standard Deviation (Population) | 5.3% | 4.0% |
Similar Demographics by Female Disability
Demographics Similar to Moroccans by Female Disability
In terms of female disability, the demographic groups most similar to Moroccans are Danish (12.1%, a difference of 0.020%), Immigrants from Middle Africa (12.1%, a difference of 0.020%), Ghanaian (12.1%, a difference of 0.19%), Syrian (12.1%, a difference of 0.20%), and Immigrants from Central America (12.1%, a difference of 0.24%).
| Demographics | Rating | Rank | Female Disability |
| Greeks | 82.0 /100 | #149 | Excellent 12.0% |
| Immigrants | Moldova | 81.4 /100 | #150 | Excellent 12.0% |
| Icelanders | 80.7 /100 | #151 | Excellent 12.0% |
| Immigrants | Scotland | 79.3 /100 | #152 | Good 12.0% |
| Sudanese | 79.1 /100 | #153 | Good 12.0% |
| Syrians | 76.9 /100 | #154 | Good 12.1% |
| Ghanaians | 76.6 /100 | #155 | Good 12.1% |
| Moroccans | 72.9 /100 | #156 | Good 12.1% |
| Danes | 72.5 /100 | #157 | Good 12.1% |
| Immigrants | Middle Africa | 72.4 /100 | #158 | Good 12.1% |
| Immigrants | Central America | 67.7 /100 | #159 | Good 12.1% |
| Immigrants | Guatemala | 66.0 /100 | #160 | Good 12.1% |
| Guyanese | 64.7 /100 | #161 | Good 12.1% |
| Immigrants | Ukraine | 64.3 /100 | #162 | Good 12.1% |
| Guatemalans | 63.8 /100 | #163 | Good 12.1% |
Demographics Similar to Immigrants from Grenada by Female Disability
In terms of female disability, the demographic groups most similar to Immigrants from Grenada are Immigrants from Zaire (12.3%, a difference of 0.020%), Immigrants from Cuba (12.4%, a difference of 0.020%), Croatian (12.4%, a difference of 0.020%), Immigrants from Barbados (12.3%, a difference of 0.040%), and Somali (12.3%, a difference of 0.060%).
| Demographics | Rating | Rank | Female Disability |
| Mexican American Indians | 24.9 /100 | #198 | Fair 12.3% |
| Immigrants | Trinidad and Tobago | 24.7 /100 | #199 | Fair 12.3% |
| Trinidadians and Tobagonians | 22.4 /100 | #200 | Fair 12.3% |
| Chinese | 22.1 /100 | #201 | Fair 12.3% |
| Somalis | 21.5 /100 | #202 | Fair 12.3% |
| Immigrants | Barbados | 21.1 /100 | #203 | Fair 12.3% |
| Immigrants | Zaire | 20.9 /100 | #204 | Fair 12.3% |
| Immigrants | Grenada | 20.5 /100 | #205 | Fair 12.4% |
| Immigrants | Cuba | 20.2 /100 | #206 | Fair 12.4% |
| Croatians | 20.2 /100 | #207 | Fair 12.4% |
| Basques | 17.5 /100 | #208 | Poor 12.4% |
| Mexicans | 15.7 /100 | #209 | Poor 12.4% |
| Swiss | 14.9 /100 | #210 | Poor 12.4% |
| Immigrants | Bosnia and Herzegovina | 14.8 /100 | #211 | Poor 12.4% |
| Ute | 14.7 /100 | #212 | Poor 12.4% |