Moroccan vs Lumbee Female Disability
COMPARE
Moroccan
Lumbee
Female Disability
Female Disability Comparison
Moroccans
Lumbee
12.1%
FEMALE DISABILITY
72.9/ 100
METRIC RATING
156th/ 347
METRIC RANK
15.8%
FEMALE DISABILITY
0.0/ 100
METRIC RATING
343rd/ 347
METRIC RANK
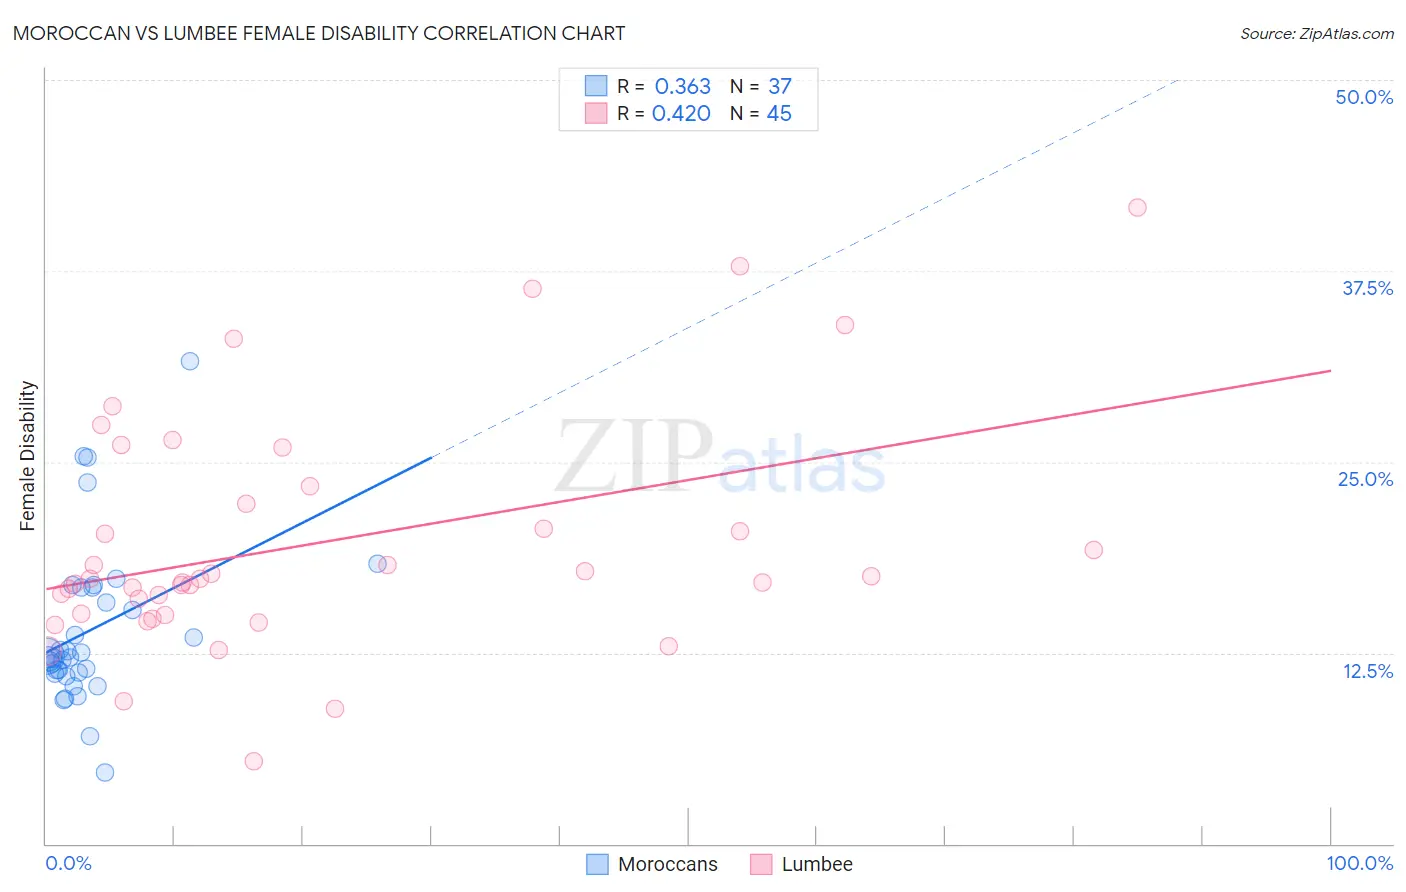
Moroccan vs Lumbee Female Disability Correlation Chart
The statistical analysis conducted on geographies consisting of 201,802,269 people shows a mild positive correlation between the proportion of Moroccans and percentage of females with a disability in the United States with a correlation coefficient (R) of 0.363 and weighted average of 12.1%. Similarly, the statistical analysis conducted on geographies consisting of 92,288,474 people shows a moderate positive correlation between the proportion of Lumbee and percentage of females with a disability in the United States with a correlation coefficient (R) of 0.420 and weighted average of 15.8%, a difference of 30.5%.
Female Disability Correlation Summary
| Measurement | Moroccan | Lumbee |
| Minimum | 4.6% | 5.4% |
| Maximum | 31.6% | 41.7% |
| Range | 27.0% | 36.3% |
| Mean | 14.0% | 19.7% |
| Median | 12.2% | 17.4% |
| Interquartile 25% (IQ1) | 11.2% | 15.0% |
| Interquartile 75% (IQ3) | 16.8% | 22.8% |
| Interquartile Range (IQR) | 5.6% | 7.8% |
| Standard Deviation (Sample) | 5.3% | 7.7% |
| Standard Deviation (Population) | 5.3% | 7.6% |
Similar Demographics by Female Disability
Demographics Similar to Moroccans by Female Disability
In terms of female disability, the demographic groups most similar to Moroccans are Danish (12.1%, a difference of 0.020%), Immigrants from Middle Africa (12.1%, a difference of 0.020%), Ghanaian (12.1%, a difference of 0.19%), Syrian (12.1%, a difference of 0.20%), and Immigrants from Central America (12.1%, a difference of 0.24%).
| Demographics | Rating | Rank | Female Disability |
| Greeks | 82.0 /100 | #149 | Excellent 12.0% |
| Immigrants | Moldova | 81.4 /100 | #150 | Excellent 12.0% |
| Icelanders | 80.7 /100 | #151 | Excellent 12.0% |
| Immigrants | Scotland | 79.3 /100 | #152 | Good 12.0% |
| Sudanese | 79.1 /100 | #153 | Good 12.0% |
| Syrians | 76.9 /100 | #154 | Good 12.1% |
| Ghanaians | 76.6 /100 | #155 | Good 12.1% |
| Moroccans | 72.9 /100 | #156 | Good 12.1% |
| Danes | 72.5 /100 | #157 | Good 12.1% |
| Immigrants | Middle Africa | 72.4 /100 | #158 | Good 12.1% |
| Immigrants | Central America | 67.7 /100 | #159 | Good 12.1% |
| Immigrants | Guatemala | 66.0 /100 | #160 | Good 12.1% |
| Guyanese | 64.7 /100 | #161 | Good 12.1% |
| Immigrants | Ukraine | 64.3 /100 | #162 | Good 12.1% |
| Guatemalans | 63.8 /100 | #163 | Good 12.1% |
Demographics Similar to Lumbee by Female Disability
In terms of female disability, the demographic groups most similar to Lumbee are Kiowa (15.8%, a difference of 0.16%), Creek (15.7%, a difference of 0.68%), Choctaw (15.4%, a difference of 2.3%), Chickasaw (15.2%, a difference of 3.7%), and Colville (15.1%, a difference of 4.7%).
| Demographics | Rating | Rank | Female Disability |
| Immigrants | Azores | 0.0 /100 | #333 | Tragic 14.9% |
| Cherokee | 0.0 /100 | #334 | Tragic 14.9% |
| Cajuns | 0.0 /100 | #335 | Tragic 14.9% |
| Seminole | 0.0 /100 | #336 | Tragic 15.0% |
| Tohono O'odham | 0.0 /100 | #337 | Tragic 15.0% |
| Dutch West Indians | 0.0 /100 | #338 | Tragic 15.0% |
| Colville | 0.0 /100 | #339 | Tragic 15.1% |
| Chickasaw | 0.0 /100 | #340 | Tragic 15.2% |
| Choctaw | 0.0 /100 | #341 | Tragic 15.4% |
| Creek | 0.0 /100 | #342 | Tragic 15.7% |
| Lumbee | 0.0 /100 | #343 | Tragic 15.8% |
| Kiowa | 0.0 /100 | #344 | Tragic 15.8% |
| Puerto Ricans | 0.0 /100 | #345 | Tragic 16.6% |
| Tsimshian | 0.0 /100 | #346 | Tragic 16.8% |
| Houma | 0.0 /100 | #347 | Tragic 16.9% |