Moroccan vs Crow Female Disability
COMPARE
Moroccan
Crow
Female Disability
Female Disability Comparison
Moroccans
Crow
12.1%
FEMALE DISABILITY
72.9/ 100
METRIC RATING
156th/ 347
METRIC RANK
12.7%
FEMALE DISABILITY
1.6/ 100
METRIC RATING
251st/ 347
METRIC RANK
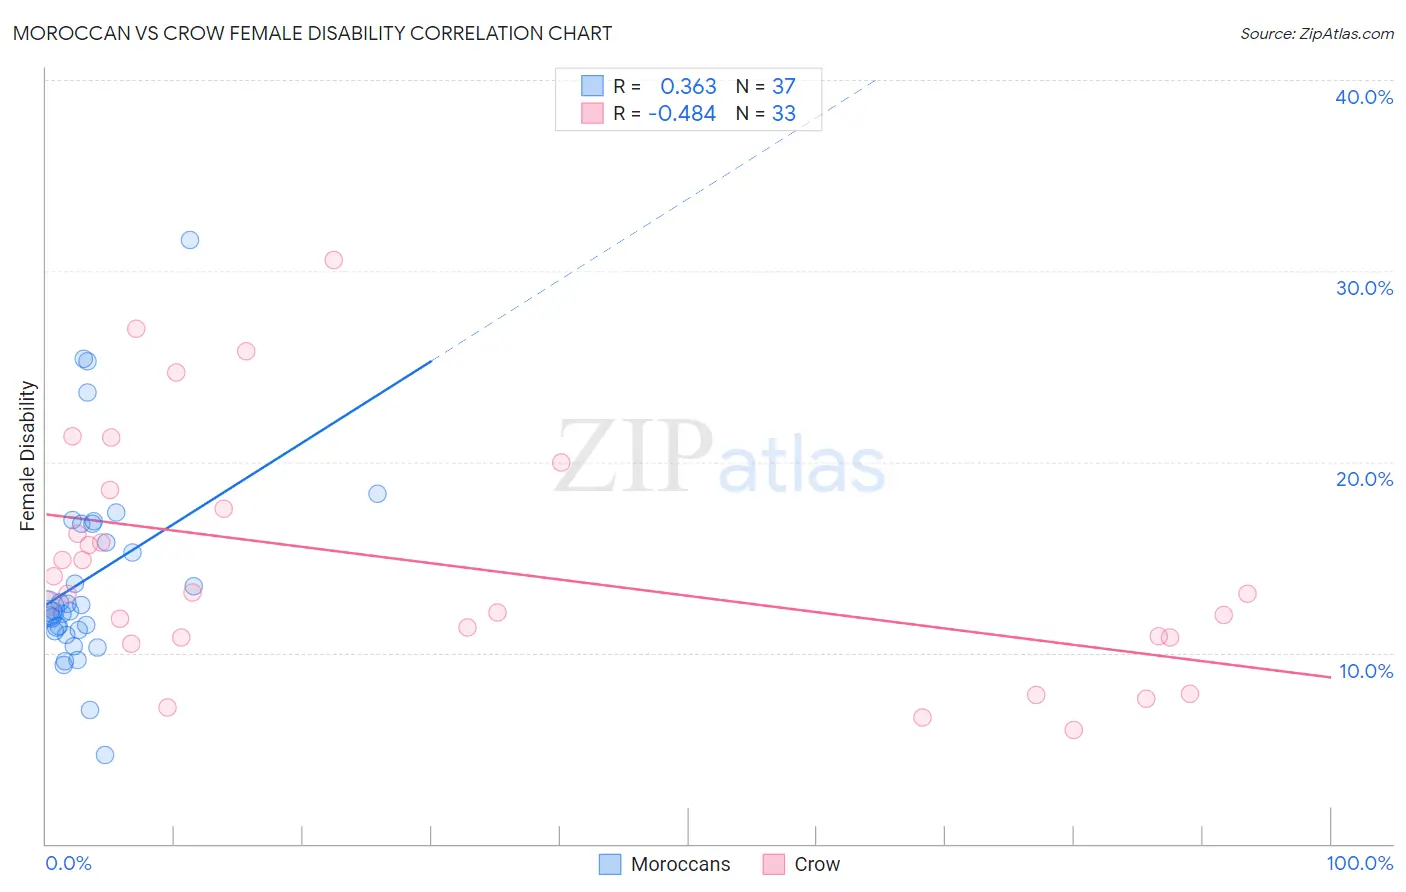
Moroccan vs Crow Female Disability Correlation Chart
The statistical analysis conducted on geographies consisting of 201,802,269 people shows a mild positive correlation between the proportion of Moroccans and percentage of females with a disability in the United States with a correlation coefficient (R) of 0.363 and weighted average of 12.1%. Similarly, the statistical analysis conducted on geographies consisting of 59,203,851 people shows a moderate negative correlation between the proportion of Crow and percentage of females with a disability in the United States with a correlation coefficient (R) of -0.484 and weighted average of 12.7%, a difference of 4.9%.
Female Disability Correlation Summary
| Measurement | Moroccan | Crow |
| Minimum | 4.6% | 5.9% |
| Maximum | 31.6% | 30.6% |
| Range | 27.0% | 24.7% |
| Mean | 14.0% | 14.6% |
| Median | 12.2% | 13.1% |
| Interquartile 25% (IQ1) | 11.2% | 10.8% |
| Interquartile 75% (IQ3) | 16.8% | 18.0% |
| Interquartile Range (IQR) | 5.6% | 7.2% |
| Standard Deviation (Sample) | 5.3% | 6.2% |
| Standard Deviation (Population) | 5.3% | 6.1% |
Similar Demographics by Female Disability
Demographics Similar to Moroccans by Female Disability
In terms of female disability, the demographic groups most similar to Moroccans are Danish (12.1%, a difference of 0.020%), Immigrants from Middle Africa (12.1%, a difference of 0.020%), Ghanaian (12.1%, a difference of 0.19%), Syrian (12.1%, a difference of 0.20%), and Immigrants from Central America (12.1%, a difference of 0.24%).
| Demographics | Rating | Rank | Female Disability |
| Greeks | 82.0 /100 | #149 | Excellent 12.0% |
| Immigrants | Moldova | 81.4 /100 | #150 | Excellent 12.0% |
| Icelanders | 80.7 /100 | #151 | Excellent 12.0% |
| Immigrants | Scotland | 79.3 /100 | #152 | Good 12.0% |
| Sudanese | 79.1 /100 | #153 | Good 12.0% |
| Syrians | 76.9 /100 | #154 | Good 12.1% |
| Ghanaians | 76.6 /100 | #155 | Good 12.1% |
| Moroccans | 72.9 /100 | #156 | Good 12.1% |
| Danes | 72.5 /100 | #157 | Good 12.1% |
| Immigrants | Middle Africa | 72.4 /100 | #158 | Good 12.1% |
| Immigrants | Central America | 67.7 /100 | #159 | Good 12.1% |
| Immigrants | Guatemala | 66.0 /100 | #160 | Good 12.1% |
| Guyanese | 64.7 /100 | #161 | Good 12.1% |
| Immigrants | Ukraine | 64.3 /100 | #162 | Good 12.1% |
| Guatemalans | 63.8 /100 | #163 | Good 12.1% |
Demographics Similar to Crow by Female Disability
In terms of female disability, the demographic groups most similar to Crow are Slovene (12.7%, a difference of 0.060%), Immigrants from Caribbean (12.7%, a difference of 0.080%), Jamaican (12.7%, a difference of 0.090%), Immigrants from Congo (12.7%, a difference of 0.10%), and Hawaiian (12.7%, a difference of 0.12%).
| Demographics | Rating | Rank | Female Disability |
| Alsatians | 2.5 /100 | #244 | Tragic 12.6% |
| Immigrants | Jamaica | 2.2 /100 | #245 | Tragic 12.6% |
| Spanish American Indians | 2.1 /100 | #246 | Tragic 12.6% |
| Menominee | 2.1 /100 | #247 | Tragic 12.6% |
| Carpatho Rusyns | 2.0 /100 | #248 | Tragic 12.6% |
| Immigrants | Congo | 1.8 /100 | #249 | Tragic 12.7% |
| Slovenes | 1.7 /100 | #250 | Tragic 12.7% |
| Crow | 1.6 /100 | #251 | Tragic 12.7% |
| Immigrants | Caribbean | 1.4 /100 | #252 | Tragic 12.7% |
| Jamaicans | 1.4 /100 | #253 | Tragic 12.7% |
| Hawaiians | 1.4 /100 | #254 | Tragic 12.7% |
| Immigrants | Germany | 1.3 /100 | #255 | Tragic 12.7% |
| British West Indians | 1.2 /100 | #256 | Tragic 12.7% |
| Liberians | 1.1 /100 | #257 | Tragic 12.7% |
| Aleuts | 1.1 /100 | #258 | Tragic 12.7% |