Moroccan vs Immigrants from Ghana Female Disability
COMPARE
Moroccan
Immigrants from Ghana
Female Disability
Female Disability Comparison
Moroccans
Immigrants from Ghana
12.1%
FEMALE DISABILITY
72.9/ 100
METRIC RATING
156th/ 347
METRIC RANK
12.2%
FEMALE DISABILITY
42.5/ 100
METRIC RATING
177th/ 347
METRIC RANK
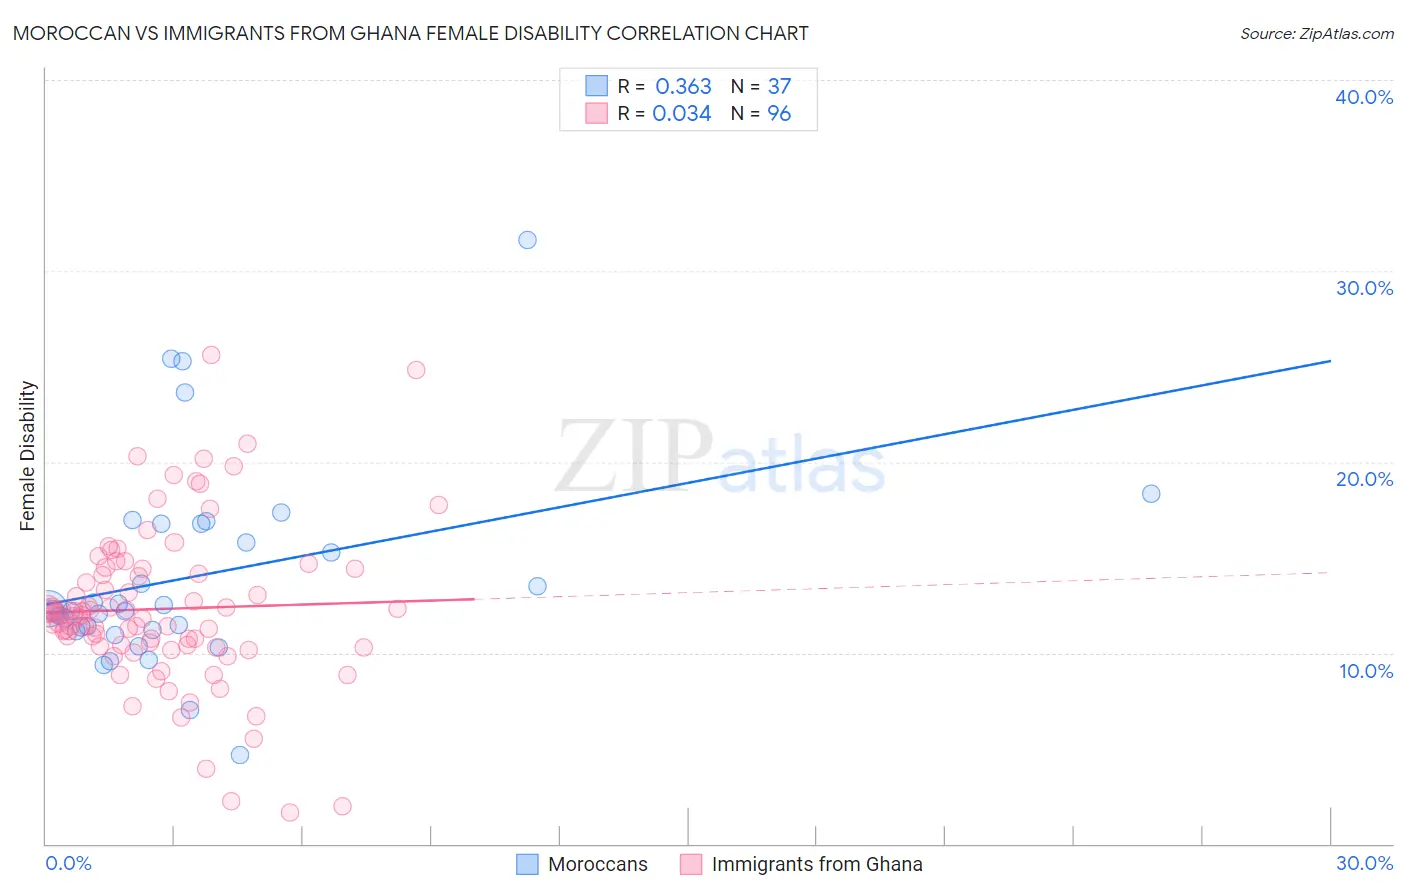
Moroccan vs Immigrants from Ghana Female Disability Correlation Chart
The statistical analysis conducted on geographies consisting of 201,802,269 people shows a mild positive correlation between the proportion of Moroccans and percentage of females with a disability in the United States with a correlation coefficient (R) of 0.363 and weighted average of 12.1%. Similarly, the statistical analysis conducted on geographies consisting of 199,930,167 people shows no correlation between the proportion of Immigrants from Ghana and percentage of females with a disability in the United States with a correlation coefficient (R) of 0.034 and weighted average of 12.2%, a difference of 1.2%.
Female Disability Correlation Summary
| Measurement | Moroccan | Immigrants from Ghana |
| Minimum | 4.6% | 1.6% |
| Maximum | 31.6% | 25.6% |
| Range | 27.0% | 24.0% |
| Mean | 14.0% | 12.3% |
| Median | 12.2% | 12.0% |
| Interquartile 25% (IQ1) | 11.2% | 10.4% |
| Interquartile 75% (IQ3) | 16.8% | 14.3% |
| Interquartile Range (IQR) | 5.6% | 3.9% |
| Standard Deviation (Sample) | 5.3% | 4.2% |
| Standard Deviation (Population) | 5.3% | 4.1% |
Similar Demographics by Female Disability
Demographics Similar to Moroccans by Female Disability
In terms of female disability, the demographic groups most similar to Moroccans are Danish (12.1%, a difference of 0.020%), Immigrants from Middle Africa (12.1%, a difference of 0.020%), Ghanaian (12.1%, a difference of 0.19%), Syrian (12.1%, a difference of 0.20%), and Immigrants from Central America (12.1%, a difference of 0.24%).
| Demographics | Rating | Rank | Female Disability |
| Greeks | 82.0 /100 | #149 | Excellent 12.0% |
| Immigrants | Moldova | 81.4 /100 | #150 | Excellent 12.0% |
| Icelanders | 80.7 /100 | #151 | Excellent 12.0% |
| Immigrants | Scotland | 79.3 /100 | #152 | Good 12.0% |
| Sudanese | 79.1 /100 | #153 | Good 12.0% |
| Syrians | 76.9 /100 | #154 | Good 12.1% |
| Ghanaians | 76.6 /100 | #155 | Good 12.1% |
| Moroccans | 72.9 /100 | #156 | Good 12.1% |
| Danes | 72.5 /100 | #157 | Good 12.1% |
| Immigrants | Middle Africa | 72.4 /100 | #158 | Good 12.1% |
| Immigrants | Central America | 67.7 /100 | #159 | Good 12.1% |
| Immigrants | Guatemala | 66.0 /100 | #160 | Good 12.1% |
| Guyanese | 64.7 /100 | #161 | Good 12.1% |
| Immigrants | Ukraine | 64.3 /100 | #162 | Good 12.1% |
| Guatemalans | 63.8 /100 | #163 | Good 12.1% |
Demographics Similar to Immigrants from Ghana by Female Disability
In terms of female disability, the demographic groups most similar to Immigrants from Ghana are Immigrants from Guyana (12.2%, a difference of 0.030%), Immigrants from Western Europe (12.2%, a difference of 0.060%), Immigrants from Fiji (12.3%, a difference of 0.17%), Albanian (12.3%, a difference of 0.18%), and Immigrants from Canada (12.3%, a difference of 0.21%).
| Demographics | Rating | Rank | Female Disability |
| Maltese | 57.0 /100 | #170 | Average 12.2% |
| Immigrants | Southern Europe | 56.3 /100 | #171 | Average 12.2% |
| Haitians | 51.9 /100 | #172 | Average 12.2% |
| Immigrants | Mexico | 50.8 /100 | #173 | Average 12.2% |
| Immigrants | England | 50.0 /100 | #174 | Average 12.2% |
| Immigrants | St. Vincent and the Grenadines | 49.7 /100 | #175 | Average 12.2% |
| Immigrants | Guyana | 43.1 /100 | #176 | Average 12.2% |
| Immigrants | Ghana | 42.5 /100 | #177 | Average 12.2% |
| Immigrants | Western Europe | 40.9 /100 | #178 | Average 12.2% |
| Immigrants | Fiji | 38.2 /100 | #179 | Fair 12.3% |
| Albanians | 37.9 /100 | #180 | Fair 12.3% |
| Immigrants | Canada | 37.2 /100 | #181 | Fair 12.3% |
| Norwegians | 36.9 /100 | #182 | Fair 12.3% |
| Cubans | 36.5 /100 | #183 | Fair 12.3% |
| Iraqis | 36.0 /100 | #184 | Fair 12.3% |