Marshallese vs Russian Male Disability
COMPARE
Marshallese
Russian
Male Disability
Male Disability Comparison
Marshallese
Russians
12.9%
MALE DISABILITY
0.0/ 100
METRIC RATING
294th/ 347
METRIC RANK
11.1%
MALE DISABILITY
69.8/ 100
METRIC RATING
156th/ 347
METRIC RANK
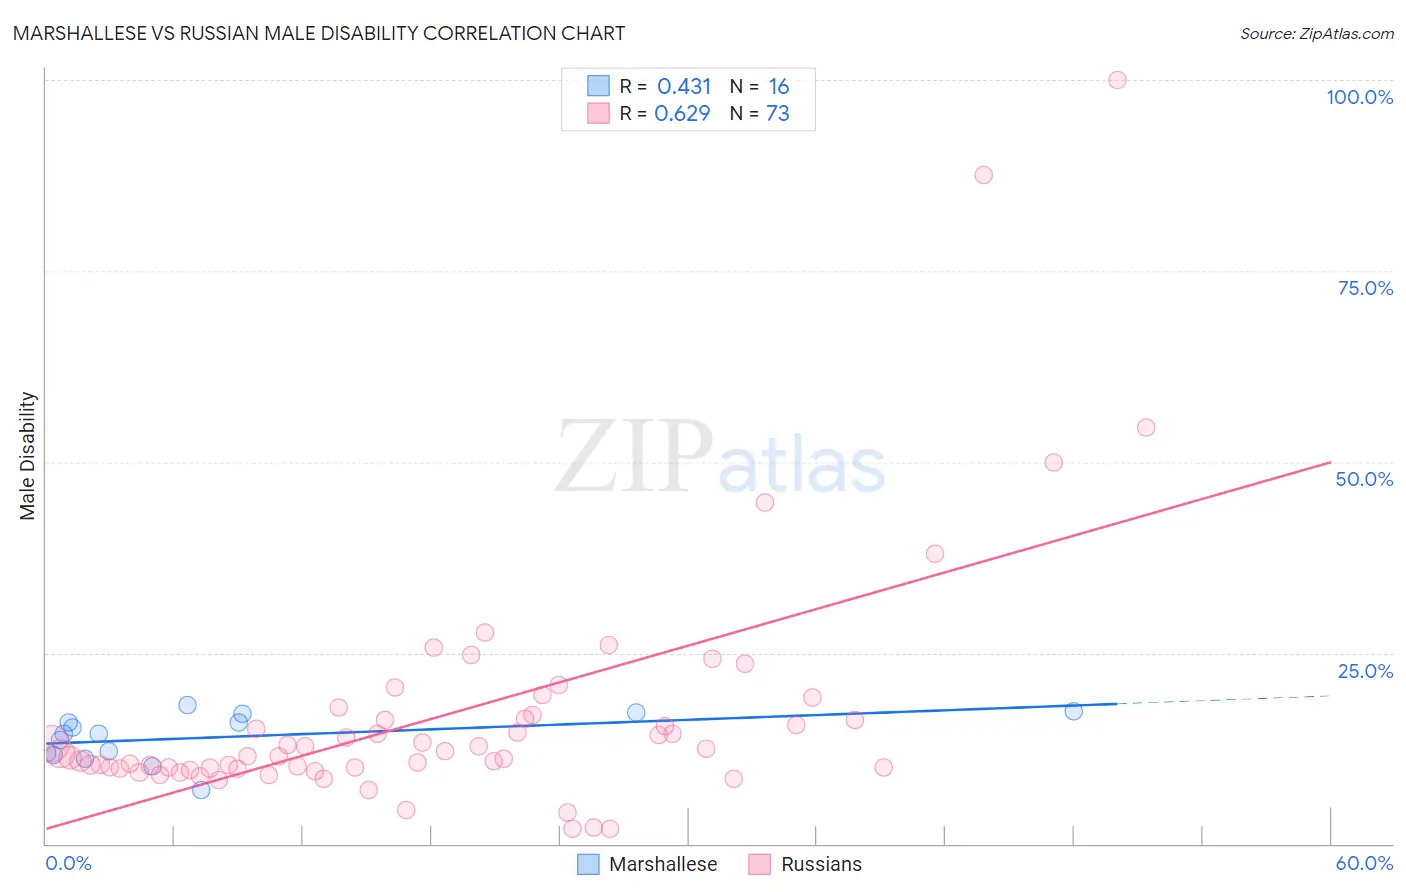
Marshallese vs Russian Male Disability Correlation Chart
The statistical analysis conducted on geographies consisting of 14,761,315 people shows a moderate positive correlation between the proportion of Marshallese and percentage of males with a disability in the United States with a correlation coefficient (R) of 0.431 and weighted average of 12.9%. Similarly, the statistical analysis conducted on geographies consisting of 512,092,434 people shows a significant positive correlation between the proportion of Russians and percentage of males with a disability in the United States with a correlation coefficient (R) of 0.629 and weighted average of 11.1%, a difference of 16.5%.
Male Disability Correlation Summary
| Measurement | Marshallese | Russian |
| Minimum | 7.0% | 2.0% |
| Maximum | 18.1% | 100.0% |
| Range | 11.1% | 98.0% |
| Mean | 13.9% | 16.8% |
| Median | 14.4% | 11.8% |
| Interquartile 25% (IQ1) | 11.8% | 9.9% |
| Interquartile 75% (IQ3) | 16.4% | 16.7% |
| Interquartile Range (IQR) | 4.6% | 6.8% |
| Standard Deviation (Sample) | 3.1% | 16.2% |
| Standard Deviation (Population) | 3.0% | 16.1% |
Similar Demographics by Male Disability
Demographics Similar to Marshallese by Male Disability
In terms of male disability, the demographic groups most similar to Marshallese are Immigrants from Micronesia (12.9%, a difference of 0.10%), Nonimmigrants (12.9%, a difference of 0.16%), Yaqui (12.9%, a difference of 0.24%), Inupiat (13.0%, a difference of 0.27%), and Pennsylvania German (13.0%, a difference of 0.47%).
| Demographics | Rating | Rank | Male Disability |
| Cape Verdeans | 0.0 /100 | #287 | Tragic 12.8% |
| Yup'ik | 0.0 /100 | #288 | Tragic 12.8% |
| Immigrants | Cabo Verde | 0.0 /100 | #289 | Tragic 12.8% |
| Pima | 0.0 /100 | #290 | Tragic 12.8% |
| Whites/Caucasians | 0.0 /100 | #291 | Tragic 12.8% |
| English | 0.0 /100 | #292 | Tragic 12.8% |
| Yaqui | 0.0 /100 | #293 | Tragic 12.9% |
| Marshallese | 0.0 /100 | #294 | Tragic 12.9% |
| Immigrants | Micronesia | 0.0 /100 | #295 | Tragic 12.9% |
| Immigrants | Nonimmigrants | 0.0 /100 | #296 | Tragic 12.9% |
| Inupiat | 0.0 /100 | #297 | Tragic 13.0% |
| Pennsylvania Germans | 0.0 /100 | #298 | Tragic 13.0% |
| Celtics | 0.0 /100 | #299 | Tragic 13.0% |
| Cheyenne | 0.0 /100 | #300 | Tragic 13.0% |
| French | 0.0 /100 | #301 | Tragic 13.0% |
Demographics Similar to Russians by Male Disability
In terms of male disability, the demographic groups most similar to Russians are Immigrants from Western Africa (11.1%, a difference of 0.040%), Immigrants from Middle Africa (11.1%, a difference of 0.070%), Latvian (11.1%, a difference of 0.11%), Guatemalan (11.1%, a difference of 0.17%), and Immigrants from Moldova (11.1%, a difference of 0.21%).
| Demographics | Rating | Rank | Male Disability |
| Immigrants | Denmark | 76.4 /100 | #149 | Good 11.0% |
| Immigrants | Guatemala | 75.1 /100 | #150 | Good 11.0% |
| Cubans | 74.9 /100 | #151 | Good 11.0% |
| Immigrants | Albania | 74.4 /100 | #152 | Good 11.0% |
| Immigrants | Northern Europe | 73.2 /100 | #153 | Good 11.1% |
| Immigrants | Moldova | 72.8 /100 | #154 | Good 11.1% |
| Immigrants | Middle Africa | 70.9 /100 | #155 | Good 11.1% |
| Russians | 69.8 /100 | #156 | Good 11.1% |
| Immigrants | Western Africa | 69.2 /100 | #157 | Good 11.1% |
| Latvians | 68.1 /100 | #158 | Good 11.1% |
| Guatemalans | 67.2 /100 | #159 | Good 11.1% |
| Albanians | 66.5 /100 | #160 | Good 11.1% |
| Immigrants | West Indies | 65.7 /100 | #161 | Good 11.1% |
| Immigrants | Haiti | 65.3 /100 | #162 | Good 11.1% |
| Immigrants | Kenya | 63.8 /100 | #163 | Good 11.1% |