Marshallese vs Immigrants from Kuwait Male Disability
COMPARE
Marshallese
Immigrants from Kuwait
Male Disability
Male Disability Comparison
Marshallese
Immigrants from Kuwait
12.9%
MALE DISABILITY
0.0/ 100
METRIC RATING
294th/ 347
METRIC RANK
10.2%
MALE DISABILITY
99.8/ 100
METRIC RATING
38th/ 347
METRIC RANK
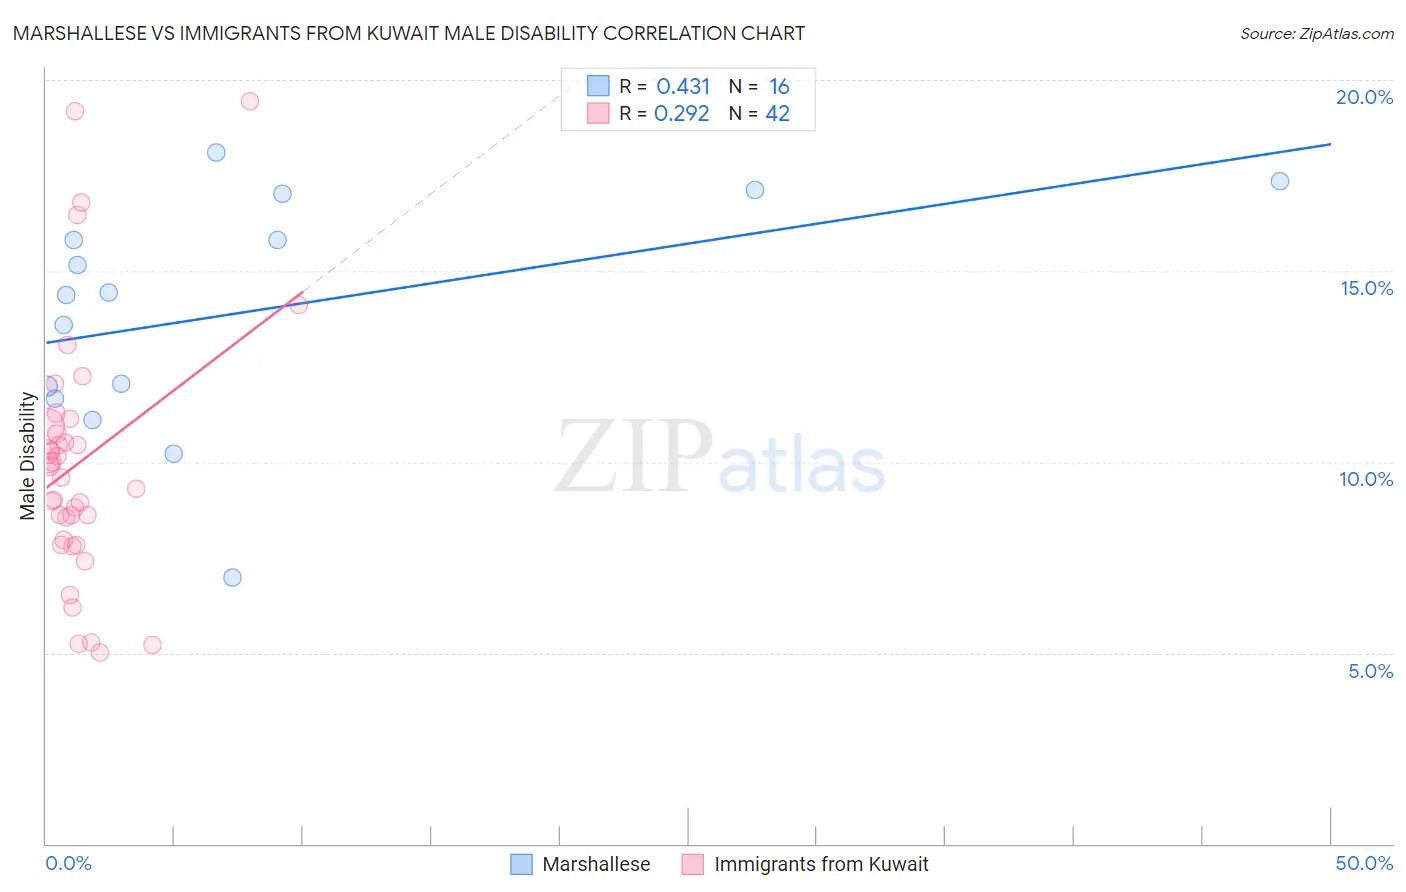
Marshallese vs Immigrants from Kuwait Male Disability Correlation Chart
The statistical analysis conducted on geographies consisting of 14,761,315 people shows a moderate positive correlation between the proportion of Marshallese and percentage of males with a disability in the United States with a correlation coefficient (R) of 0.431 and weighted average of 12.9%. Similarly, the statistical analysis conducted on geographies consisting of 136,916,630 people shows a weak positive correlation between the proportion of Immigrants from Kuwait and percentage of males with a disability in the United States with a correlation coefficient (R) of 0.292 and weighted average of 10.2%, a difference of 26.2%.
Male Disability Correlation Summary
| Measurement | Marshallese | Immigrants from Kuwait |
| Minimum | 7.0% | 5.0% |
| Maximum | 18.1% | 19.4% |
| Range | 11.1% | 14.4% |
| Mean | 13.9% | 10.0% |
| Median | 14.4% | 9.7% |
| Interquartile 25% (IQ1) | 11.8% | 7.9% |
| Interquartile 75% (IQ3) | 16.4% | 10.9% |
| Interquartile Range (IQR) | 4.6% | 3.0% |
| Standard Deviation (Sample) | 3.1% | 3.4% |
| Standard Deviation (Population) | 3.0% | 3.3% |
Similar Demographics by Male Disability
Demographics Similar to Marshallese by Male Disability
In terms of male disability, the demographic groups most similar to Marshallese are Immigrants from Micronesia (12.9%, a difference of 0.10%), Nonimmigrants (12.9%, a difference of 0.16%), Yaqui (12.9%, a difference of 0.24%), Inupiat (13.0%, a difference of 0.27%), and Pennsylvania German (13.0%, a difference of 0.47%).
| Demographics | Rating | Rank | Male Disability |
| Cape Verdeans | 0.0 /100 | #287 | Tragic 12.8% |
| Yup'ik | 0.0 /100 | #288 | Tragic 12.8% |
| Immigrants | Cabo Verde | 0.0 /100 | #289 | Tragic 12.8% |
| Pima | 0.0 /100 | #290 | Tragic 12.8% |
| Whites/Caucasians | 0.0 /100 | #291 | Tragic 12.8% |
| English | 0.0 /100 | #292 | Tragic 12.8% |
| Yaqui | 0.0 /100 | #293 | Tragic 12.9% |
| Marshallese | 0.0 /100 | #294 | Tragic 12.9% |
| Immigrants | Micronesia | 0.0 /100 | #295 | Tragic 12.9% |
| Immigrants | Nonimmigrants | 0.0 /100 | #296 | Tragic 12.9% |
| Inupiat | 0.0 /100 | #297 | Tragic 13.0% |
| Pennsylvania Germans | 0.0 /100 | #298 | Tragic 13.0% |
| Celtics | 0.0 /100 | #299 | Tragic 13.0% |
| Cheyenne | 0.0 /100 | #300 | Tragic 13.0% |
| French | 0.0 /100 | #301 | Tragic 13.0% |
Demographics Similar to Immigrants from Kuwait by Male Disability
In terms of male disability, the demographic groups most similar to Immigrants from Kuwait are Afghan (10.2%, a difference of 0.16%), Immigrants from Indonesia (10.2%, a difference of 0.17%), Ethiopian (10.2%, a difference of 0.24%), Immigrants from Argentina (10.2%, a difference of 0.29%), and Immigrants from Nepal (10.3%, a difference of 0.35%).
| Demographics | Rating | Rank | Male Disability |
| Soviet Union | 99.9 /100 | #31 | Exceptional 10.1% |
| Argentineans | 99.9 /100 | #32 | Exceptional 10.1% |
| Immigrants | Ethiopia | 99.9 /100 | #33 | Exceptional 10.2% |
| Immigrants | Turkey | 99.9 /100 | #34 | Exceptional 10.2% |
| Immigrants | Argentina | 99.9 /100 | #35 | Exceptional 10.2% |
| Ethiopians | 99.8 /100 | #36 | Exceptional 10.2% |
| Immigrants | Indonesia | 99.8 /100 | #37 | Exceptional 10.2% |
| Immigrants | Kuwait | 99.8 /100 | #38 | Exceptional 10.2% |
| Afghans | 99.8 /100 | #39 | Exceptional 10.2% |
| Immigrants | Nepal | 99.8 /100 | #40 | Exceptional 10.3% |
| Taiwanese | 99.8 /100 | #41 | Exceptional 10.3% |
| Mongolians | 99.7 /100 | #42 | Exceptional 10.3% |
| Immigrants | Bangladesh | 99.7 /100 | #43 | Exceptional 10.3% |
| Immigrants | El Salvador | 99.7 /100 | #44 | Exceptional 10.3% |
| Turks | 99.7 /100 | #45 | Exceptional 10.3% |