Guamanian/Chamorro vs Cape Verdean Hearing Disability
COMPARE
Guamanian/Chamorro
Cape Verdean
Hearing Disability
Hearing Disability Comparison
Guamanians/Chamorros
Cape Verdeans
3.3%
HEARING DISABILITY
2.2/ 100
METRIC RATING
235th/ 347
METRIC RANK
3.1%
HEARING DISABILITY
12.2/ 100
METRIC RATING
210th/ 347
METRIC RANK
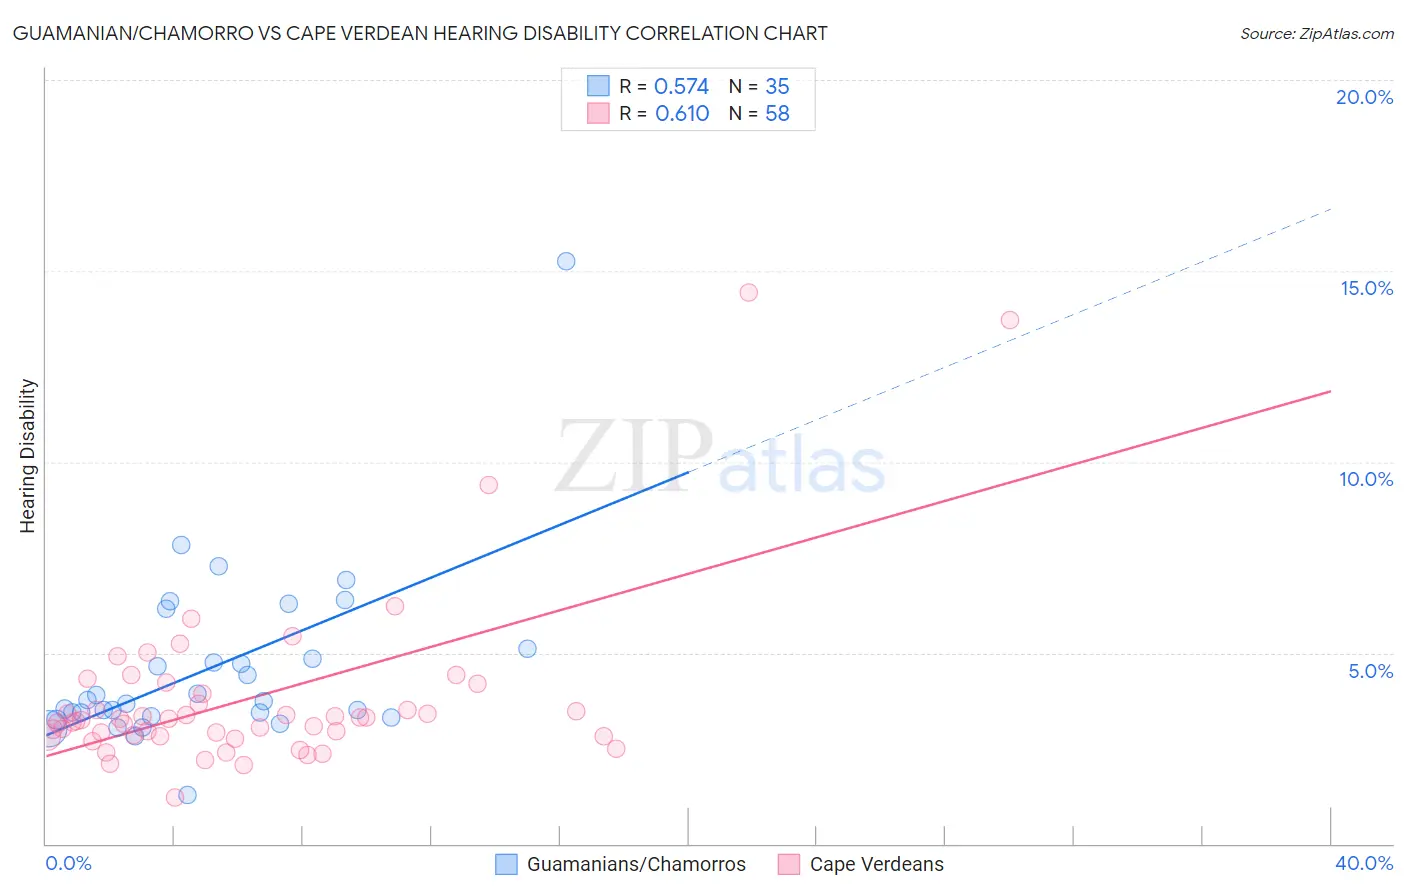
Guamanian/Chamorro vs Cape Verdean Hearing Disability Correlation Chart
The statistical analysis conducted on geographies consisting of 221,861,125 people shows a substantial positive correlation between the proportion of Guamanians/Chamorros and percentage of population with hearing disability in the United States with a correlation coefficient (R) of 0.574 and weighted average of 3.3%. Similarly, the statistical analysis conducted on geographies consisting of 107,552,896 people shows a significant positive correlation between the proportion of Cape Verdeans and percentage of population with hearing disability in the United States with a correlation coefficient (R) of 0.610 and weighted average of 3.1%, a difference of 4.1%.
Hearing Disability Correlation Summary
| Measurement | Guamanian/Chamorro | Cape Verdean |
| Minimum | 1.3% | 1.2% |
| Maximum | 15.2% | 14.5% |
| Range | 14.0% | 13.2% |
| Mean | 4.6% | 3.8% |
| Median | 3.7% | 3.2% |
| Interquartile 25% (IQ1) | 3.3% | 2.8% |
| Interquartile 75% (IQ3) | 5.1% | 3.9% |
| Interquartile Range (IQR) | 1.8% | 1.1% |
| Standard Deviation (Sample) | 2.4% | 2.3% |
| Standard Deviation (Population) | 2.3% | 2.3% |
Similar Demographics by Hearing Disability
Demographics Similar to Guamanians/Chamorros by Hearing Disability
In terms of hearing disability, the demographic groups most similar to Guamanians/Chamorros are Serbian (3.3%, a difference of 0.060%), Central American Indian (3.3%, a difference of 0.10%), Estonian (3.3%, a difference of 0.17%), Immigrants from Austria (3.3%, a difference of 0.46%), and German Russian (3.3%, a difference of 0.46%).
| Demographics | Rating | Rank | Hearing Disability |
| Immigrants | Portugal | 4.3 /100 | #228 | Tragic 3.2% |
| Maltese | 4.1 /100 | #229 | Tragic 3.2% |
| Greeks | 3.2 /100 | #230 | Tragic 3.2% |
| Luxembourgers | 2.9 /100 | #231 | Tragic 3.2% |
| Ukrainians | 2.9 /100 | #232 | Tragic 3.2% |
| Estonians | 2.4 /100 | #233 | Tragic 3.3% |
| Central American Indians | 2.3 /100 | #234 | Tragic 3.3% |
| Guamanians/Chamorros | 2.2 /100 | #235 | Tragic 3.3% |
| Serbians | 2.2 /100 | #236 | Tragic 3.3% |
| Immigrants | Austria | 1.8 /100 | #237 | Tragic 3.3% |
| German Russians | 1.8 /100 | #238 | Tragic 3.3% |
| Nepalese | 1.2 /100 | #239 | Tragic 3.3% |
| Immigrants | Netherlands | 1.1 /100 | #240 | Tragic 3.3% |
| Samoans | 1.1 /100 | #241 | Tragic 3.3% |
| Yugoslavians | 1.0 /100 | #242 | Tragic 3.3% |
Demographics Similar to Cape Verdeans by Hearing Disability
In terms of hearing disability, the demographic groups most similar to Cape Verdeans are Romanian (3.1%, a difference of 0.040%), Immigrants from Hungary (3.1%, a difference of 0.050%), Immigrants from Latvia (3.1%, a difference of 0.090%), Pakistani (3.1%, a difference of 0.25%), and Immigrants from Iraq (3.1%, a difference of 0.39%).
| Demographics | Rating | Rank | Hearing Disability |
| Immigrants | Denmark | 16.2 /100 | #203 | Poor 3.1% |
| Immigrants | Czechoslovakia | 15.9 /100 | #204 | Poor 3.1% |
| Alsatians | 15.9 /100 | #205 | Poor 3.1% |
| Eastern Europeans | 15.5 /100 | #206 | Poor 3.1% |
| Hispanics or Latinos | 15.1 /100 | #207 | Poor 3.1% |
| Immigrants | Latvia | 12.7 /100 | #208 | Poor 3.1% |
| Immigrants | Hungary | 12.5 /100 | #209 | Poor 3.1% |
| Cape Verdeans | 12.2 /100 | #210 | Poor 3.1% |
| Romanians | 12.1 /100 | #211 | Poor 3.1% |
| Pakistanis | 11.1 /100 | #212 | Poor 3.1% |
| Immigrants | Iraq | 10.5 /100 | #213 | Poor 3.1% |
| Australians | 8.1 /100 | #214 | Tragic 3.2% |
| Bangladeshis | 8.1 /100 | #215 | Tragic 3.2% |
| Immigrants | Norway | 7.3 /100 | #216 | Tragic 3.2% |
| Russians | 7.1 /100 | #217 | Tragic 3.2% |