Guamanian/Chamorro vs Immigrants from Ghana Hearing Disability
COMPARE
Guamanian/Chamorro
Immigrants from Ghana
Hearing Disability
Hearing Disability Comparison
Guamanians/Chamorros
Immigrants from Ghana
3.3%
HEARING DISABILITY
2.2/ 100
METRIC RATING
235th/ 347
METRIC RANK
2.6%
HEARING DISABILITY
99.8/ 100
METRIC RATING
24th/ 347
METRIC RANK
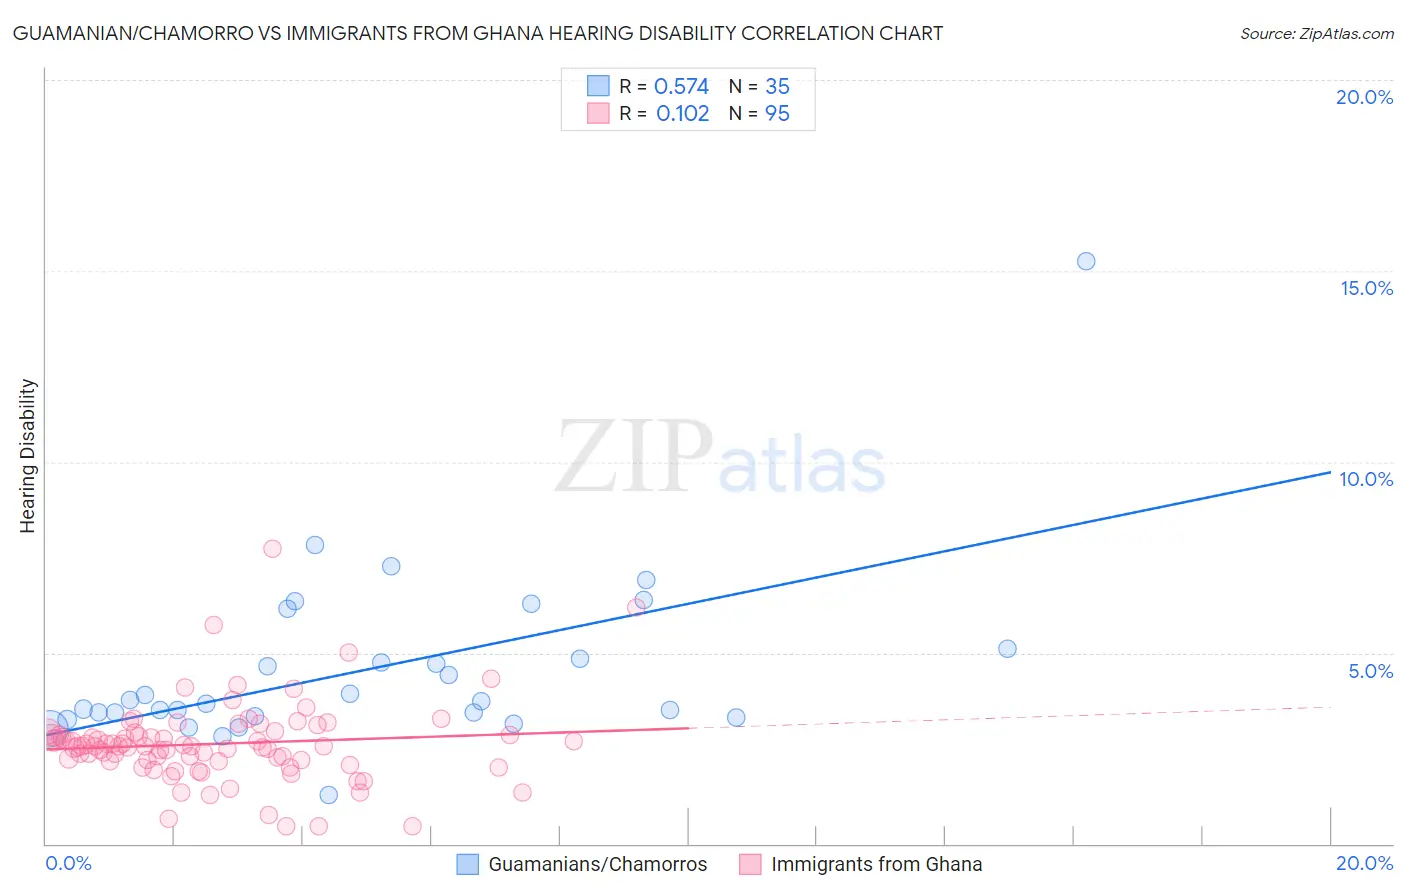
Guamanian/Chamorro vs Immigrants from Ghana Hearing Disability Correlation Chart
The statistical analysis conducted on geographies consisting of 221,861,125 people shows a substantial positive correlation between the proportion of Guamanians/Chamorros and percentage of population with hearing disability in the United States with a correlation coefficient (R) of 0.574 and weighted average of 3.3%. Similarly, the statistical analysis conducted on geographies consisting of 199,883,907 people shows a poor positive correlation between the proportion of Immigrants from Ghana and percentage of population with hearing disability in the United States with a correlation coefficient (R) of 0.102 and weighted average of 2.6%, a difference of 26.9%.
Hearing Disability Correlation Summary
| Measurement | Guamanian/Chamorro | Immigrants from Ghana |
| Minimum | 1.3% | 0.44% |
| Maximum | 15.2% | 7.7% |
| Range | 14.0% | 7.3% |
| Mean | 4.6% | 2.6% |
| Median | 3.7% | 2.6% |
| Interquartile 25% (IQ1) | 3.3% | 2.2% |
| Interquartile 75% (IQ3) | 5.1% | 2.8% |
| Interquartile Range (IQR) | 1.8% | 0.69% |
| Standard Deviation (Sample) | 2.4% | 1.1% |
| Standard Deviation (Population) | 2.3% | 1.1% |
Similar Demographics by Hearing Disability
Demographics Similar to Guamanians/Chamorros by Hearing Disability
In terms of hearing disability, the demographic groups most similar to Guamanians/Chamorros are Serbian (3.3%, a difference of 0.060%), Central American Indian (3.3%, a difference of 0.10%), Estonian (3.3%, a difference of 0.17%), Immigrants from Austria (3.3%, a difference of 0.46%), and German Russian (3.3%, a difference of 0.46%).
| Demographics | Rating | Rank | Hearing Disability |
| Immigrants | Portugal | 4.3 /100 | #228 | Tragic 3.2% |
| Maltese | 4.1 /100 | #229 | Tragic 3.2% |
| Greeks | 3.2 /100 | #230 | Tragic 3.2% |
| Luxembourgers | 2.9 /100 | #231 | Tragic 3.2% |
| Ukrainians | 2.9 /100 | #232 | Tragic 3.2% |
| Estonians | 2.4 /100 | #233 | Tragic 3.3% |
| Central American Indians | 2.3 /100 | #234 | Tragic 3.3% |
| Guamanians/Chamorros | 2.2 /100 | #235 | Tragic 3.3% |
| Serbians | 2.2 /100 | #236 | Tragic 3.3% |
| Immigrants | Austria | 1.8 /100 | #237 | Tragic 3.3% |
| German Russians | 1.8 /100 | #238 | Tragic 3.3% |
| Nepalese | 1.2 /100 | #239 | Tragic 3.3% |
| Immigrants | Netherlands | 1.1 /100 | #240 | Tragic 3.3% |
| Samoans | 1.1 /100 | #241 | Tragic 3.3% |
| Yugoslavians | 1.0 /100 | #242 | Tragic 3.3% |
Demographics Similar to Immigrants from Ghana by Hearing Disability
In terms of hearing disability, the demographic groups most similar to Immigrants from Ghana are Immigrants from Nigeria (2.6%, a difference of 0.25%), Immigrants from El Salvador (2.6%, a difference of 0.40%), Immigrants from Senegal (2.6%, a difference of 0.41%), Immigrants from South Central Asia (2.6%, a difference of 0.45%), and Immigrants from Sierra Leone (2.6%, a difference of 0.75%).
| Demographics | Rating | Rank | Hearing Disability |
| Immigrants | India | 99.9 /100 | #17 | Exceptional 2.5% |
| Dominicans | 99.8 /100 | #18 | Exceptional 2.5% |
| Thais | 99.8 /100 | #19 | Exceptional 2.5% |
| Immigrants | Bolivia | 99.8 /100 | #20 | Exceptional 2.5% |
| Ghanaians | 99.8 /100 | #21 | Exceptional 2.5% |
| Immigrants | Sierra Leone | 99.8 /100 | #22 | Exceptional 2.6% |
| Immigrants | Nigeria | 99.8 /100 | #23 | Exceptional 2.6% |
| Immigrants | Ghana | 99.8 /100 | #24 | Exceptional 2.6% |
| Immigrants | El Salvador | 99.7 /100 | #25 | Exceptional 2.6% |
| Immigrants | Senegal | 99.7 /100 | #26 | Exceptional 2.6% |
| Immigrants | South Central Asia | 99.7 /100 | #27 | Exceptional 2.6% |
| Immigrants | Haiti | 99.7 /100 | #28 | Exceptional 2.6% |
| Bolivians | 99.7 /100 | #29 | Exceptional 2.6% |
| Immigrants | Caribbean | 99.7 /100 | #30 | Exceptional 2.6% |
| Immigrants | Cameroon | 99.7 /100 | #31 | Exceptional 2.6% |