Armenian vs Alaska Native Female Disability
COMPARE
Armenian
Alaska Native
Female Disability
Female Disability Comparison
Armenians
Alaska Natives
12.3%
FEMALE DISABILITY
29.7/ 100
METRIC RATING
191st/ 347
METRIC RANK
12.8%
FEMALE DISABILITY
0.6/ 100
METRIC RATING
264th/ 347
METRIC RANK
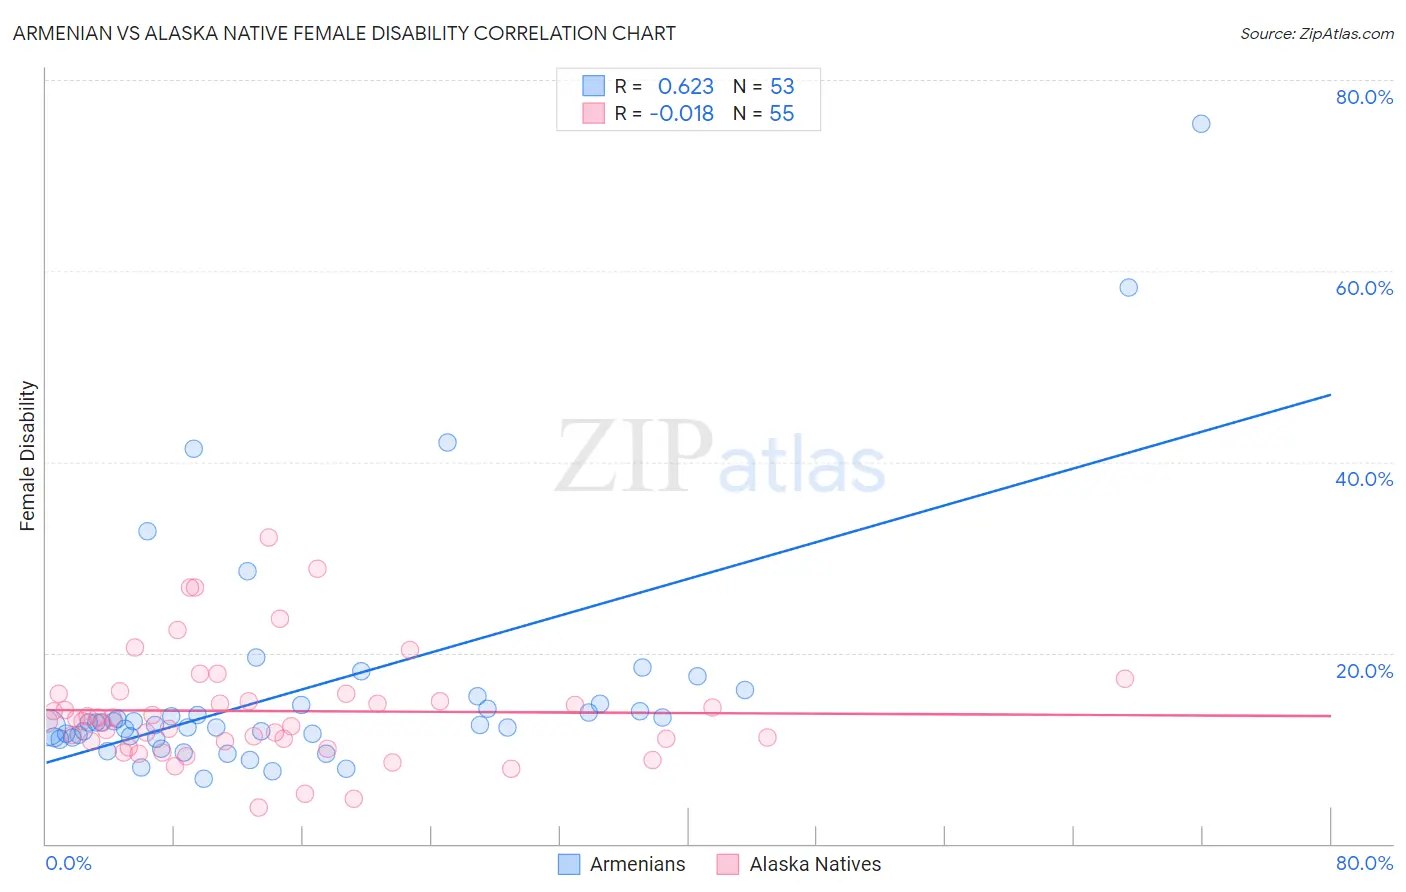
Armenian vs Alaska Native Female Disability Correlation Chart
The statistical analysis conducted on geographies consisting of 310,925,320 people shows a significant positive correlation between the proportion of Armenians and percentage of females with a disability in the United States with a correlation coefficient (R) of 0.623 and weighted average of 12.3%. Similarly, the statistical analysis conducted on geographies consisting of 76,769,198 people shows no correlation between the proportion of Alaska Natives and percentage of females with a disability in the United States with a correlation coefficient (R) of -0.018 and weighted average of 12.8%, a difference of 4.0%.
Female Disability Correlation Summary
| Measurement | Armenian | Alaska Native |
| Minimum | 6.9% | 3.8% |
| Maximum | 75.4% | 32.1% |
| Range | 68.5% | 28.4% |
| Mean | 16.2% | 13.9% |
| Median | 12.5% | 12.9% |
| Interquartile 25% (IQ1) | 11.2% | 10.7% |
| Interquartile 75% (IQ3) | 14.6% | 15.7% |
| Interquartile Range (IQR) | 3.4% | 5.0% |
| Standard Deviation (Sample) | 12.4% | 5.7% |
| Standard Deviation (Population) | 12.3% | 5.7% |
Similar Demographics by Female Disability
Demographics Similar to Armenians by Female Disability
In terms of female disability, the demographic groups most similar to Armenians are Immigrants from Western Africa (12.3%, a difference of 0.020%), Immigrants from Honduras (12.3%, a difference of 0.070%), Immigrants from Albania (12.3%, a difference of 0.080%), Northern European (12.3%, a difference of 0.10%), and Ukrainian (12.3%, a difference of 0.11%).
| Demographics | Rating | Rank | Female Disability |
| Iraqis | 36.0 /100 | #184 | Fair 12.3% |
| Immigrants | Uzbekistan | 33.9 /100 | #185 | Fair 12.3% |
| Austrians | 33.3 /100 | #186 | Fair 12.3% |
| Serbians | 33.1 /100 | #187 | Fair 12.3% |
| Immigrants | North America | 32.8 /100 | #188 | Fair 12.3% |
| Immigrants | Albania | 31.6 /100 | #189 | Fair 12.3% |
| Immigrants | Honduras | 31.3 /100 | #190 | Fair 12.3% |
| Armenians | 29.7 /100 | #191 | Fair 12.3% |
| Immigrants | Western Africa | 29.2 /100 | #192 | Fair 12.3% |
| Northern Europeans | 27.5 /100 | #193 | Fair 12.3% |
| Ukrainians | 27.2 /100 | #194 | Fair 12.3% |
| Swedes | 26.6 /100 | #195 | Fair 12.3% |
| Immigrants | Panama | 25.5 /100 | #196 | Fair 12.3% |
| Hondurans | 25.4 /100 | #197 | Fair 12.3% |
| Mexican American Indians | 24.9 /100 | #198 | Fair 12.3% |
Demographics Similar to Alaska Natives by Female Disability
In terms of female disability, the demographic groups most similar to Alaska Natives are Spaniard (12.8%, a difference of 0.12%), West Indian (12.8%, a difference of 0.19%), Finnish (12.8%, a difference of 0.31%), Senegalese (12.8%, a difference of 0.32%), and Czechoslovakian (12.7%, a difference of 0.35%).
| Demographics | Rating | Rank | Female Disability |
| Liberians | 1.1 /100 | #257 | Tragic 12.7% |
| Aleuts | 1.1 /100 | #258 | Tragic 12.7% |
| Immigrants | Armenia | 1.0 /100 | #259 | Tragic 12.7% |
| Sub-Saharan Africans | 1.0 /100 | #260 | Tragic 12.7% |
| Bermudans | 1.0 /100 | #261 | Tragic 12.7% |
| Czechoslovakians | 0.9 /100 | #262 | Tragic 12.7% |
| Spaniards | 0.7 /100 | #263 | Tragic 12.8% |
| Alaska Natives | 0.6 /100 | #264 | Tragic 12.8% |
| West Indians | 0.5 /100 | #265 | Tragic 12.8% |
| Finns | 0.4 /100 | #266 | Tragic 12.8% |
| Senegalese | 0.4 /100 | #267 | Tragic 12.8% |
| Immigrants | Laos | 0.4 /100 | #268 | Tragic 12.8% |
| Indonesians | 0.4 /100 | #269 | Tragic 12.8% |
| Immigrants | Liberia | 0.3 /100 | #270 | Tragic 12.9% |
| Dutch | 0.2 /100 | #271 | Tragic 12.9% |