Armenian vs Immigrants from Belarus Female Disability
COMPARE
Armenian
Immigrants from Belarus
Female Disability
Female Disability Comparison
Armenians
Immigrants from Belarus
12.3%
FEMALE DISABILITY
29.7/ 100
METRIC RATING
191st/ 347
METRIC RANK
11.8%
FEMALE DISABILITY
97.8/ 100
METRIC RATING
113th/ 347
METRIC RANK
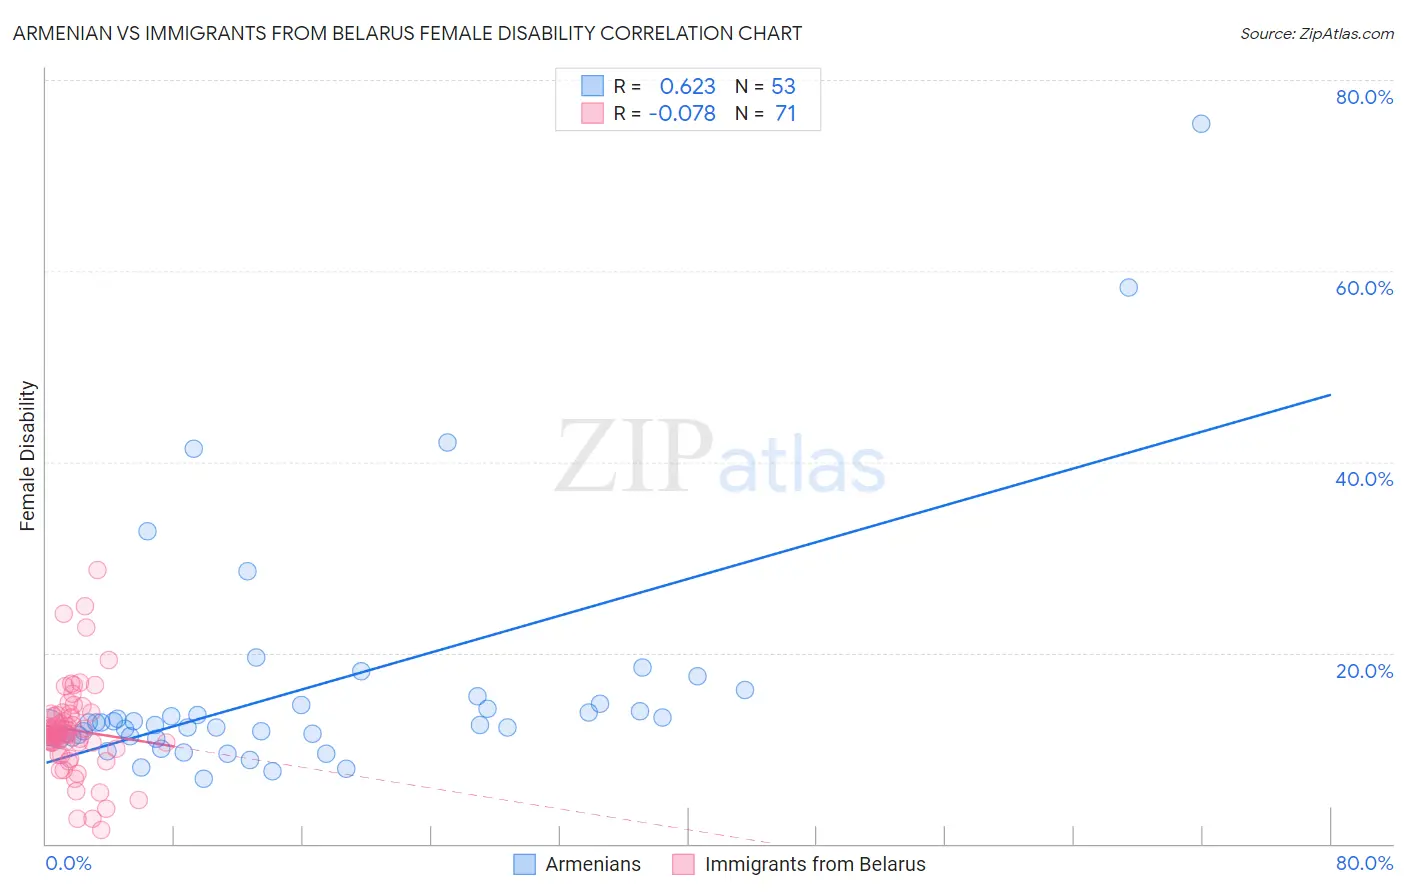
Armenian vs Immigrants from Belarus Female Disability Correlation Chart
The statistical analysis conducted on geographies consisting of 310,925,320 people shows a significant positive correlation between the proportion of Armenians and percentage of females with a disability in the United States with a correlation coefficient (R) of 0.623 and weighted average of 12.3%. Similarly, the statistical analysis conducted on geographies consisting of 150,193,098 people shows a slight negative correlation between the proportion of Immigrants from Belarus and percentage of females with a disability in the United States with a correlation coefficient (R) of -0.078 and weighted average of 11.8%, a difference of 4.5%.
Female Disability Correlation Summary
| Measurement | Armenian | Immigrants from Belarus |
| Minimum | 6.9% | 1.5% |
| Maximum | 75.4% | 28.7% |
| Range | 68.5% | 27.2% |
| Mean | 16.2% | 11.9% |
| Median | 12.5% | 11.5% |
| Interquartile 25% (IQ1) | 11.2% | 10.6% |
| Interquartile 75% (IQ3) | 14.6% | 13.6% |
| Interquartile Range (IQR) | 3.4% | 3.0% |
| Standard Deviation (Sample) | 12.4% | 4.7% |
| Standard Deviation (Population) | 12.3% | 4.7% |
Similar Demographics by Female Disability
Demographics Similar to Armenians by Female Disability
In terms of female disability, the demographic groups most similar to Armenians are Immigrants from Western Africa (12.3%, a difference of 0.020%), Immigrants from Honduras (12.3%, a difference of 0.070%), Immigrants from Albania (12.3%, a difference of 0.080%), Northern European (12.3%, a difference of 0.10%), and Ukrainian (12.3%, a difference of 0.11%).
| Demographics | Rating | Rank | Female Disability |
| Iraqis | 36.0 /100 | #184 | Fair 12.3% |
| Immigrants | Uzbekistan | 33.9 /100 | #185 | Fair 12.3% |
| Austrians | 33.3 /100 | #186 | Fair 12.3% |
| Serbians | 33.1 /100 | #187 | Fair 12.3% |
| Immigrants | North America | 32.8 /100 | #188 | Fair 12.3% |
| Immigrants | Albania | 31.6 /100 | #189 | Fair 12.3% |
| Immigrants | Honduras | 31.3 /100 | #190 | Fair 12.3% |
| Armenians | 29.7 /100 | #191 | Fair 12.3% |
| Immigrants | Western Africa | 29.2 /100 | #192 | Fair 12.3% |
| Northern Europeans | 27.5 /100 | #193 | Fair 12.3% |
| Ukrainians | 27.2 /100 | #194 | Fair 12.3% |
| Swedes | 26.6 /100 | #195 | Fair 12.3% |
| Immigrants | Panama | 25.5 /100 | #196 | Fair 12.3% |
| Hondurans | 25.4 /100 | #197 | Fair 12.3% |
| Mexican American Indians | 24.9 /100 | #198 | Fair 12.3% |
Demographics Similar to Immigrants from Belarus by Female Disability
In terms of female disability, the demographic groups most similar to Immigrants from Belarus are Immigrants from Bangladesh (11.8%, a difference of 0.010%), South African (11.8%, a difference of 0.030%), Brazilian (11.8%, a difference of 0.030%), Immigrants from Morocco (11.8%, a difference of 0.070%), and Costa Rican (11.7%, a difference of 0.13%).
| Demographics | Rating | Rank | Female Disability |
| Immigrants | Greece | 98.2 /100 | #106 | Exceptional 11.7% |
| Latvians | 98.2 /100 | #107 | Exceptional 11.7% |
| New Zealanders | 98.1 /100 | #108 | Exceptional 11.7% |
| Immigrants | Immigrants | 98.1 /100 | #109 | Exceptional 11.7% |
| Soviet Union | 98.1 /100 | #110 | Exceptional 11.7% |
| Costa Ricans | 98.1 /100 | #111 | Exceptional 11.7% |
| Immigrants | Bangladesh | 97.8 /100 | #112 | Exceptional 11.8% |
| Immigrants | Belarus | 97.8 /100 | #113 | Exceptional 11.8% |
| South Africans | 97.7 /100 | #114 | Exceptional 11.8% |
| Brazilians | 97.7 /100 | #115 | Exceptional 11.8% |
| Immigrants | Morocco | 97.6 /100 | #116 | Exceptional 11.8% |
| Immigrants | Eastern Europe | 97.2 /100 | #117 | Exceptional 11.8% |
| Immigrants | Nigeria | 97.2 /100 | #118 | Exceptional 11.8% |
| Immigrants | Uganda | 97.2 /100 | #119 | Exceptional 11.8% |
| Immigrants | Kazakhstan | 97.0 /100 | #120 | Exceptional 11.8% |