Zip Codes with the Highest Percentage of Self-Employed / Not Incorporated in Washington, DC

RELATED REPORTS & OPTIONS

Self-Employed / Not Incorporated
Population
Families and Households
Female Fertility
Female Fertility (Unmarried)
Race (Community Size)
Race (Percentage)
Ancestry (Community Size)
AfghanAfricanAlbanianAlsatianAmericanApacheArabArgentineanArmenianAssyrian / Chaldean / SyriacAustralianAustrianBahamianBarbadianBasqueBelgianBelizeanBermudanBhutaneseBlackfeetBolivianBrazilianBritishBritish West IndianBulgarianBurmeseCajunCambodianCanadianCape VerdeanCelticCentral AmericanCentral American IndianCherokeeChickasawChileanChineseChippewaChoctawColombianCosta RicanCreeCreekCroatianCubanCypriotCzechCzechoslovakianDanishDominicanDutchEastern EuropeanEcuadorianEgyptianEnglishEstonianEthiopianEuropeanFilipinoFinnishFrenchFrench American IndianFrench CanadianGermanGhanaianGreekGuamanian / ChamorroGuatemalanGuyaneseHaitianHonduranHungarianIcelanderIndian (Asian)IndonesianIranianIraqiIrishIroquoisIsraeliItalianJamaicanJapaneseJordanianKenyanKoreanLaotianLatvianLebaneseLiberianLithuanianLumbeeLuxembourgerMacedonianMalaysianMalteseMexicanMexican American IndianMongolianMoroccanNative HawaiianNavajoNew ZealanderNicaraguanNigerianNorthern EuropeanNorwegianOkinawanPakistaniPalestinianPanamanianParaguayanPennsylvania GermanPeruvianPolishPortuguesePuebloPuerto RicanRomanianRussianSalvadoranSamoanScandinavianScotch-IrishScottishSeminoleSenegaleseSerbianSierra LeoneanSlavicSlovakSloveneSomaliSouth AfricanSouth AmericanSouth American IndianSpaniardSpanishSri LankanSubsaharan AfricanSudaneseSwedishSwissSyrianThaiTlingit-HaidaTrinidadian and TobagonianTurkishU.S. Virgin IslanderUgandanUkrainianUruguayanVenezuelanVietnameseWelshWest IndianYugoslavianZimbabwean
Ancestry (Percentage)
AfghanAfricanAlbanianAlsatianAmericanApacheArabArgentineanArmenianAssyrian / Chaldean / SyriacAustralianAustrianBahamianBarbadianBasqueBelgianBelizeanBermudanBhutaneseBlackfeetBolivianBrazilianBritishBritish West IndianBulgarianBurmeseCajunCambodianCanadianCape VerdeanCelticCentral AmericanCentral American IndianCherokeeChickasawChileanChineseChippewaChoctawColombianCosta RicanCreeCreekCroatianCubanCypriotCzechCzechoslovakianDanishDominicanDutchEastern EuropeanEcuadorianEgyptianEnglishEstonianEthiopianEuropeanFilipinoFinnishFrenchFrench American IndianFrench CanadianGermanGhanaianGreekGuamanian / ChamorroGuatemalanGuyaneseHaitianHonduranHungarianIcelanderIndian (Asian)IndonesianIranianIraqiIrishIroquoisIsraeliItalianJamaicanJapaneseJordanianKenyanKoreanLaotianLatvianLebaneseLiberianLithuanianLumbeeLuxembourgerMacedonianMalaysianMalteseMexicanMexican American IndianMongolianMoroccanNative HawaiianNavajoNew ZealanderNicaraguanNigerianNorthern EuropeanNorwegianOkinawanPakistaniPalestinianPanamanianParaguayanPennsylvania GermanPeruvianPolishPortuguesePuebloPuerto RicanRomanianRussianSalvadoranSamoanScandinavianScotch-IrishScottishSeminoleSenegaleseSerbianSierra LeoneanSlavicSlovakSloveneSomaliSouth AfricanSouth AmericanSouth American IndianSpaniardSpanishSri LankanSubsaharan AfricanSudaneseSwedishSwissSyrianThaiTlingit-HaidaTrinidadian and TobagonianTurkishU.S. Virgin IslanderUgandanUkrainianUruguayanVenezuelanVietnameseWelshWest IndianYugoslavianZimbabwean
Immigrant Origin (Total)
AfghanistanAfricaAlbaniaArgentinaArmeniaAsiaAustraliaAustriaBahamasBangladeshBarbadosBelarusBelgiumBelizeBoliviaBrazilBulgariaBurma / MyanmarCambodiaCameroonCanadaCaribbeanCentral AmericaChileChinaColombiaCongoCosta RicaCroatiaCubaCzechoslovakiaDenmarkDominicaDominican RepublicEastern AfricaEastern AsiaEastern EuropeEcuadorEgyptEl SalvadorEnglandEritreaEthiopiaEuropeFranceGermanyGhanaGreeceGrenadaGuatemalaGuyanaHaitiHondurasHong KongHungaryIndiaIndonesiaIranIraqIrelandIsraelItalyJamaicaJapanJordanKazakhstanKenyaKoreaKuwaitLatin AmericaLatviaLebanonLiberiaLithuaniaMalaysiaMexicoMiddle AfricaMoroccoNepalNetherlandsNicaraguaNigeriaNorthern AfricaNorthern EuropeNorwayOceaniaPakistanPanamaPeruPhilippinesPolandPortugalRomaniaRussiaSaudi ArabiaScotlandSenegalSerbiaSierra LeoneSingaporeSomaliaSouth AfricaSouth AmericaSouth Central AsiaSouth Eastern AsiaSouthern EuropeSpainSri LankaSt. Vincent and the GrenadinesSudanSwedenSwitzerlandSyriaTaiwanThailandTrinidad and TobagoTurkeyUgandaUkraineUruguayUzbekistanVenezuelaVietnamWest IndiesWestern AfricaWestern AsiaWestern EuropeZaireZimbabwe
Immigrant Origin (Percentage)
AfghanistanAfricaAlbaniaArgentinaArmeniaAsiaAustraliaAustriaBahamasBangladeshBarbadosBelarusBelgiumBelizeBoliviaBrazilBulgariaBurma / MyanmarCambodiaCameroonCanadaCaribbeanCentral AmericaChileChinaColombiaCongoCosta RicaCroatiaCubaCzechoslovakiaDenmarkDominicaDominican RepublicEastern AfricaEastern AsiaEastern EuropeEcuadorEgyptEl SalvadorEnglandEritreaEthiopiaEuropeFranceGermanyGhanaGreeceGrenadaGuatemalaGuyanaHaitiHondurasHong KongHungaryIndiaIndonesiaIranIraqIrelandIsraelItalyJamaicaJapanJordanKazakhstanKenyaKoreaKuwaitLatin AmericaLatviaLebanonLiberiaLithuaniaMalaysiaMexicoMiddle AfricaMoroccoNepalNetherlandsNicaraguaNigeriaNorthern AfricaNorthern EuropeNorwayOceaniaPakistanPanamaPeruPhilippinesPolandPortugalRomaniaRussiaSaudi ArabiaScotlandSenegalSerbiaSierra LeoneSingaporeSomaliaSouth AfricaSouth AmericaSouth Central AsiaSouth Eastern AsiaSouthern EuropeSpainSri LankaSt. Vincent and the GrenadinesSudanSwedenSwitzerlandSyriaTaiwanThailandTrinidad and TobagoTurkeyUgandaUkraineUruguayUzbekistanVenezuelaVietnamWest IndiesWestern AfricaWestern AsiaWestern EuropeZaireZimbabwe
Income
Income (Families)
Income (Households)
Poverty
Poverty (Families)
Unemployment
Employment Occupations
Employment Industries
Employer Class
Commute Time
Commute Means
School Enrollment
Education by Degree Field
Occupancy
Finances
Physical Characteristics
Washington
Compare Zip Codes
Comparison Subject

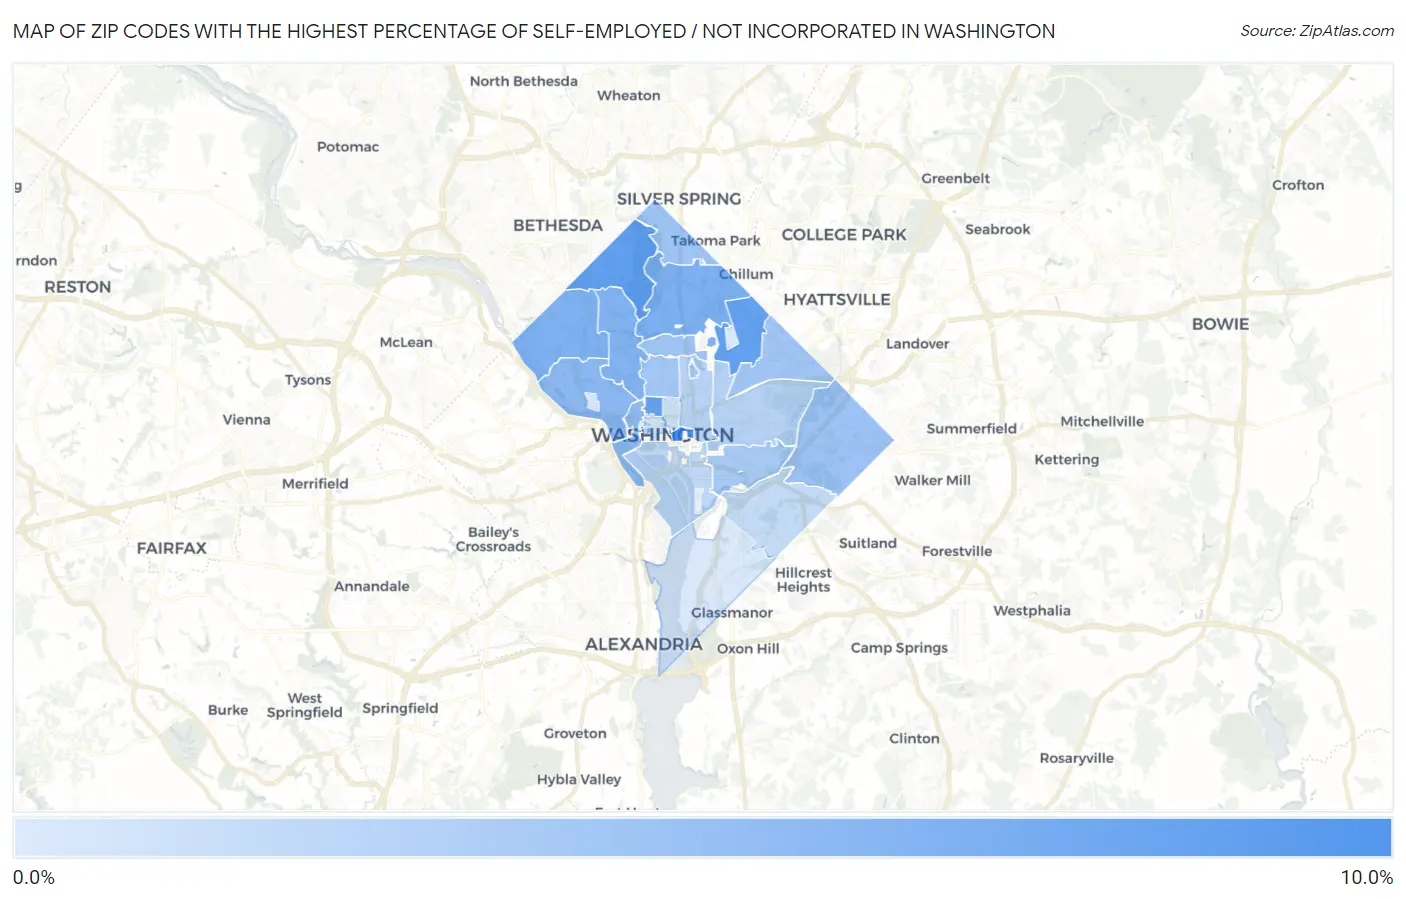
Map of Zip Codes with the Highest Percentage of Self-Employed / Not Incorporated in Washington

0.0%
10.0%
Zip Codes with the Highest Percentage of Self-Employed / Not Incorporated in Washington Map

Zip Codes with the Highest Percentage of Self-Employed / Not Incorporated in Washington, DC

Zip Code % Self-Employed / Not Incorporated vs State vs National
1.200048.7%4.3%(+4.38)#15.8%(+2.86)#9,350
2.200157.4%4.3%(+3.11)#25.8%(+1.59)#12,041
3.200177.3%4.3%(+3.01)#35.8%(+1.50)#12,264
4.200367.3%4.3%(+2.95)#45.8%(+1.44)#12,388
5.200116.0%4.3%(+1.71)#55.8%(+0.195)#16,041
6.200166.0%4.3%(+1.68)#65.8%(+0.159)#16,160
7.200085.8%4.3%(+1.54)#75.8%(+0.025)#16,580
8.200075.3%4.3%(+0.969)#85.8%(-0.550)#18,634
9.200375.1%4.3%(+0.827)#95.8%(-0.692)#19,211
10.200194.6%4.3%(+0.255)#105.8%(-1.26)#21,358
11.200104.4%4.3%(+0.079)#115.8%(-1.44)#22,049
12.200124.3%4.3%(+0.017)#125.8%(-1.50)#22,258
13.200184.3%4.3%(+0.003)#135.8%(-1.52)#22,321
14.200594.2%4.3%(-0.086)#145.8%(-1.61)#22,645
15.200094.1%4.3%(-0.190)#155.8%(-1.71)#23,026
16.200033.9%4.3%(-0.402)#165.8%(-1.92)#23,751
17.200023.3%4.3%(-0.995)#175.8%(-2.51)#25,596
18.200013.2%4.3%(-1.11)#185.8%(-2.62)#25,905
19.200242.8%4.3%(-1.49)#195.8%(-3.01)#26,823
20.200202.6%4.3%(-1.66)#205.8%(-3.18)#27,172
21.200052.3%4.3%(-2.04)#215.8%(-3.56)#27,833
22.200062.1%4.3%(-2.19)#225.8%(-3.71)#28,085
23.200571.8%4.3%(-2.47)#235.8%(-3.99)#28,447
24.200321.6%4.3%(-2.74)#245.8%(-4.26)#28,684
25.200641.4%4.3%(-2.89)#255.8%(-4.41)#28,832

Common Questions

What are the Top 10 Zip Codes with the Highest Percentage of Self-Employed / Not Incorporated in Washington, DC?
Top 10 Zip Codes with the Highest Percentage of Self-Employed / Not Incorporated in Washington, DC are:
#1
8.7%
#2
7.4%
#3
7.3%
#4
7.3%
#5
6.0%
#6
6.0%
#7
5.8%
#8
5.3%
#9
5.1%
#10
4.6%
What zip code has the Highest Percentage of Self-Employed / Not Incorporated in Washington, DC?
20004 has the Highest Percentage of Self-Employed / Not Incorporated in Washington, DC with 8.7%.
What is the Percentage of Self-Employed / Not Incorporated in Washington, DC?
Percentage of Self-Employed / Not Incorporated in Washington is 4.3%.
What is the Percentage of Self-Employed / Not Incorporated in District Of Columbia?
Percentage of Self-Employed / Not Incorporated in District Of Columbia is 4.3%.
What is the Percentage of Self-Employed / Not Incorporated in the United States?
Percentage of Self-Employed / Not Incorporated in the United States is 5.8%.