Zip Codes with the Highest Percentage of Population Employed in Computer & Mathematics in Washington, DC

RELATED REPORTS & OPTIONS

Computer & Mathematics
Population
Families and Households
Female Fertility
Female Fertility (Unmarried)
Race (Community Size)
Race (Percentage)
Ancestry (Community Size)
AfghanAfricanAlbanianAlsatianAmericanApacheArabArgentineanArmenianAssyrian / Chaldean / SyriacAustralianAustrianBahamianBarbadianBasqueBelgianBelizeanBermudanBhutaneseBlackfeetBolivianBrazilianBritishBritish West IndianBulgarianBurmeseCajunCambodianCanadianCape VerdeanCelticCentral AmericanCentral American IndianCherokeeChickasawChileanChineseChippewaChoctawColombianCosta RicanCreeCreekCroatianCubanCypriotCzechCzechoslovakianDanishDominicanDutchEastern EuropeanEcuadorianEgyptianEnglishEstonianEthiopianEuropeanFilipinoFinnishFrenchFrench American IndianFrench CanadianGermanGhanaianGreekGuamanian / ChamorroGuatemalanGuyaneseHaitianHonduranHungarianIcelanderIndian (Asian)IndonesianIranianIraqiIrishIroquoisIsraeliItalianJamaicanJapaneseJordanianKenyanKoreanLaotianLatvianLebaneseLiberianLithuanianLumbeeLuxembourgerMacedonianMalaysianMalteseMexicanMexican American IndianMongolianMoroccanNative HawaiianNavajoNew ZealanderNicaraguanNigerianNorthern EuropeanNorwegianOkinawanPakistaniPalestinianPanamanianParaguayanPennsylvania GermanPeruvianPolishPortuguesePuebloPuerto RicanRomanianRussianSalvadoranSamoanScandinavianScotch-IrishScottishSeminoleSenegaleseSerbianSierra LeoneanSlavicSlovakSloveneSomaliSouth AfricanSouth AmericanSouth American IndianSpaniardSpanishSri LankanSubsaharan AfricanSudaneseSwedishSwissSyrianThaiTlingit-HaidaTrinidadian and TobagonianTurkishU.S. Virgin IslanderUgandanUkrainianUruguayanVenezuelanVietnameseWelshWest IndianYugoslavianZimbabwean
Ancestry (Percentage)
AfghanAfricanAlbanianAlsatianAmericanApacheArabArgentineanArmenianAssyrian / Chaldean / SyriacAustralianAustrianBahamianBarbadianBasqueBelgianBelizeanBermudanBhutaneseBlackfeetBolivianBrazilianBritishBritish West IndianBulgarianBurmeseCajunCambodianCanadianCape VerdeanCelticCentral AmericanCentral American IndianCherokeeChickasawChileanChineseChippewaChoctawColombianCosta RicanCreeCreekCroatianCubanCypriotCzechCzechoslovakianDanishDominicanDutchEastern EuropeanEcuadorianEgyptianEnglishEstonianEthiopianEuropeanFilipinoFinnishFrenchFrench American IndianFrench CanadianGermanGhanaianGreekGuamanian / ChamorroGuatemalanGuyaneseHaitianHonduranHungarianIcelanderIndian (Asian)IndonesianIranianIraqiIrishIroquoisIsraeliItalianJamaicanJapaneseJordanianKenyanKoreanLaotianLatvianLebaneseLiberianLithuanianLumbeeLuxembourgerMacedonianMalaysianMalteseMexicanMexican American IndianMongolianMoroccanNative HawaiianNavajoNew ZealanderNicaraguanNigerianNorthern EuropeanNorwegianOkinawanPakistaniPalestinianPanamanianParaguayanPennsylvania GermanPeruvianPolishPortuguesePuebloPuerto RicanRomanianRussianSalvadoranSamoanScandinavianScotch-IrishScottishSeminoleSenegaleseSerbianSierra LeoneanSlavicSlovakSloveneSomaliSouth AfricanSouth AmericanSouth American IndianSpaniardSpanishSri LankanSubsaharan AfricanSudaneseSwedishSwissSyrianThaiTlingit-HaidaTrinidadian and TobagonianTurkishU.S. Virgin IslanderUgandanUkrainianUruguayanVenezuelanVietnameseWelshWest IndianYugoslavianZimbabwean
Immigrant Origin (Total)
AfghanistanAfricaAlbaniaArgentinaArmeniaAsiaAustraliaAustriaBahamasBangladeshBarbadosBelarusBelgiumBelizeBoliviaBrazilBulgariaBurma / MyanmarCambodiaCameroonCanadaCaribbeanCentral AmericaChileChinaColombiaCongoCosta RicaCroatiaCubaCzechoslovakiaDenmarkDominicaDominican RepublicEastern AfricaEastern AsiaEastern EuropeEcuadorEgyptEl SalvadorEnglandEritreaEthiopiaEuropeFranceGermanyGhanaGreeceGrenadaGuatemalaGuyanaHaitiHondurasHong KongHungaryIndiaIndonesiaIranIraqIrelandIsraelItalyJamaicaJapanJordanKazakhstanKenyaKoreaKuwaitLatin AmericaLatviaLebanonLiberiaLithuaniaMalaysiaMexicoMiddle AfricaMoroccoNepalNetherlandsNicaraguaNigeriaNorthern AfricaNorthern EuropeNorwayOceaniaPakistanPanamaPeruPhilippinesPolandPortugalRomaniaRussiaSaudi ArabiaScotlandSenegalSerbiaSierra LeoneSingaporeSomaliaSouth AfricaSouth AmericaSouth Central AsiaSouth Eastern AsiaSouthern EuropeSpainSri LankaSt. Vincent and the GrenadinesSudanSwedenSwitzerlandSyriaTaiwanThailandTrinidad and TobagoTurkeyUgandaUkraineUruguayUzbekistanVenezuelaVietnamWest IndiesWestern AfricaWestern AsiaWestern EuropeZaireZimbabwe
Immigrant Origin (Percentage)
AfghanistanAfricaAlbaniaArgentinaArmeniaAsiaAustraliaAustriaBahamasBangladeshBarbadosBelarusBelgiumBelizeBoliviaBrazilBulgariaBurma / MyanmarCambodiaCameroonCanadaCaribbeanCentral AmericaChileChinaColombiaCongoCosta RicaCroatiaCubaCzechoslovakiaDenmarkDominicaDominican RepublicEastern AfricaEastern AsiaEastern EuropeEcuadorEgyptEl SalvadorEnglandEritreaEthiopiaEuropeFranceGermanyGhanaGreeceGrenadaGuatemalaGuyanaHaitiHondurasHong KongHungaryIndiaIndonesiaIranIraqIrelandIsraelItalyJamaicaJapanJordanKazakhstanKenyaKoreaKuwaitLatin AmericaLatviaLebanonLiberiaLithuaniaMalaysiaMexicoMiddle AfricaMoroccoNepalNetherlandsNicaraguaNigeriaNorthern AfricaNorthern EuropeNorwayOceaniaPakistanPanamaPeruPhilippinesPolandPortugalRomaniaRussiaSaudi ArabiaScotlandSenegalSerbiaSierra LeoneSingaporeSomaliaSouth AfricaSouth AmericaSouth Central AsiaSouth Eastern AsiaSouthern EuropeSpainSri LankaSt. Vincent and the GrenadinesSudanSwedenSwitzerlandSyriaTaiwanThailandTrinidad and TobagoTurkeyUgandaUkraineUruguayUzbekistanVenezuelaVietnamWest IndiesWestern AfricaWestern AsiaWestern EuropeZaireZimbabwe
Income
Income (Families)
Income (Households)
Poverty
Poverty (Families)
Unemployment
Employment Occupations
Employment Industries
Employer Class
Commute Time
Commute Means
School Enrollment
Education by Degree Field
Occupancy
Finances
Physical Characteristics
Washington
Compare Zip Codes
Comparison Subject

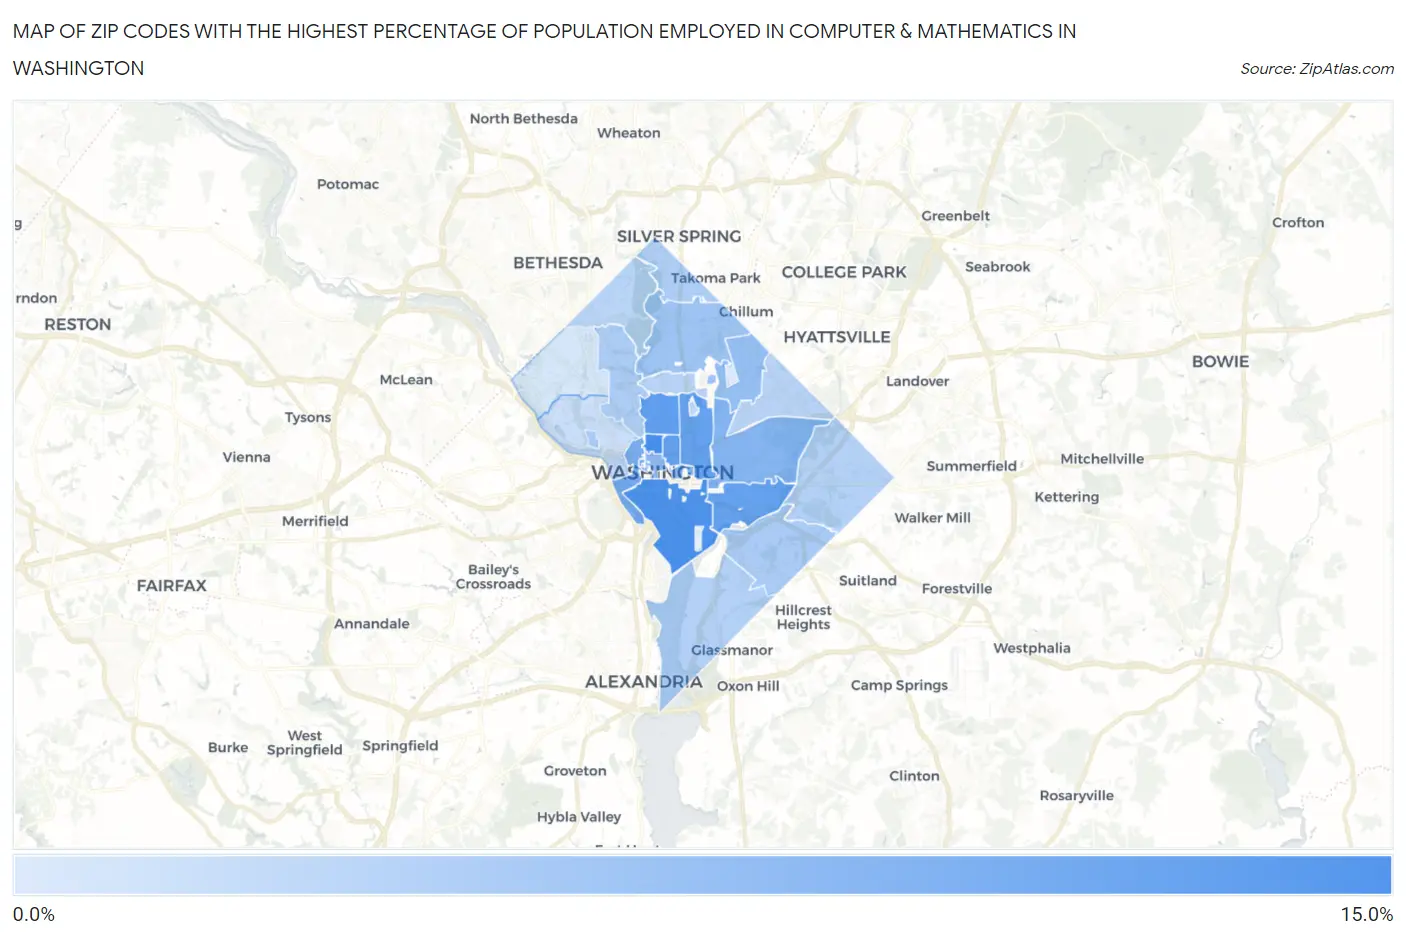
Map of Zip Codes with the Highest Percentage of Population Employed in Computer & Mathematics in Washington

0.0%
15.0%
Zip Codes with the Highest Percentage of Population Employed in Computer & Mathematics in Washington Map

Zip Codes with the Highest Percentage of Population Employed in Computer & Mathematics in Washington, DC

Zip Code % Employed vs State vs National
1.2003611.4%7.2%(+4.23)#13.5%(+7.92)#502
2.2002410.9%7.2%(+3.64)#23.5%(+7.33)#578
3.2000910.0%7.2%(+2.83)#33.5%(+6.51)#705
4.200059.8%7.2%(+2.61)#43.5%(+6.30)#740
5.200019.8%7.2%(+2.57)#53.5%(+6.26)#744
6.200039.7%7.2%(+2.51)#63.5%(+6.19)#753
7.200528.7%7.2%(+1.48)#73.5%(+5.17)#992
8.200378.6%7.2%(+1.41)#83.5%(+5.10)#1,017
9.200027.9%7.2%(+0.679)#93.5%(+4.37)#1,240
10.200047.7%7.2%(+0.529)#103.5%(+4.22)#1,301
11.200067.4%7.2%(+0.215)#113.5%(+3.90)#1,416
12.200177.0%7.2%(-0.170)#123.5%(+3.52)#1,600
13.200116.5%7.2%(-0.714)#133.5%(+2.97)#1,928
14.200576.0%7.2%(-1.17)#143.5%(+2.52)#2,277
15.200205.9%7.2%(-1.28)#153.5%(+2.40)#2,378
16.200085.7%7.2%(-1.50)#163.5%(+2.19)#2,572
17.200125.6%7.2%(-1.59)#173.5%(+2.10)#2,661
18.200325.4%7.2%(-1.83)#183.5%(+1.85)#2,913
19.200195.4%7.2%(-1.84)#193.5%(+1.85)#2,925
20.200185.2%7.2%(-2.03)#203.5%(+1.66)#3,147
21.200105.1%7.2%(-2.10)#213.5%(+1.58)#3,219
22.200155.1%7.2%(-2.15)#223.5%(+1.54)#3,283
23.200594.7%7.2%(-2.52)#233.5%(+1.17)#3,801
24.200074.1%7.2%(-3.09)#243.5%(+0.595)#4,775
25.200163.5%7.2%(-3.69)#253.5%(-0.002)#6,150
26.200643.1%7.2%(-4.07)#263.5%(-0.380)#7,278

Common Questions

What are the Top 10 Zip Codes with the Highest Percentage of Population Employed in Computer & Mathematics in Washington, DC?
Top 10 Zip Codes with the Highest Percentage of Population Employed in Computer & Mathematics in Washington, DC are:
#1
11.4%
#2
10.9%
#3
10.0%
#4
9.8%
#5
9.8%
#6
9.7%
#7
8.7%
#8
8.6%
#9
7.9%
#10
7.7%
What zip code has the Highest Percentage of Population Employed in Computer & Mathematics in Washington, DC?
20036 has the Highest Percentage of Population Employed in Computer & Mathematics in Washington, DC with 11.4%.
What is the Percentage of Population Employed in Computer & Mathematics in Washington, DC?
Percentage of Population Employed in Computer & Mathematics in Washington is 7.2%.
What is the Percentage of Population Employed in Computer & Mathematics in District Of Columbia?
Percentage of Population Employed in Computer & Mathematics in District Of Columbia is 7.2%.
What is the Percentage of Population Employed in Computer & Mathematics in the United States?
Percentage of Population Employed in Computer & Mathematics in the United States is 3.5%.