Zip Codes with the Highest Percentage of Population Employed in Business & Financial in Washington, DC
RELATED REPORTS & OPTIONS
Business & Financial
Washington
Compare Zip Codes
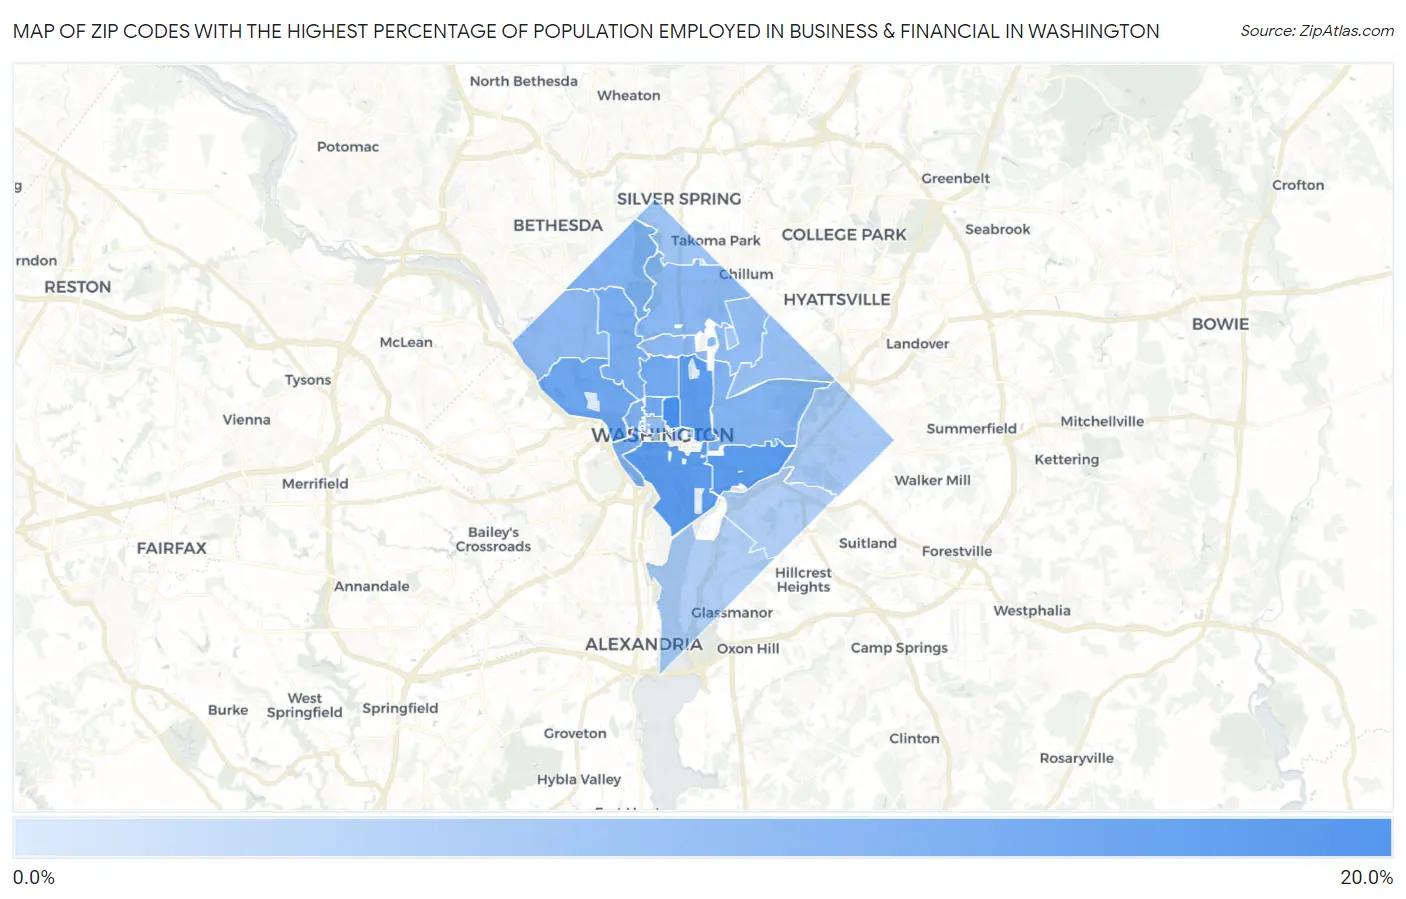
Map of Zip Codes with the Highest Percentage of Population Employed in Business & Financial in Washington
1.9%
19.6%
Zip Codes with the Highest Percentage of Population Employed in Business & Financial in Washington, DC
| Zip Code | % Employed | vs State | vs National | |
| 1. | 20005 | 19.6% | 12.4%(+7.26)#1 | 5.8%(+13.9)#291 |
| 2. | 20003 | 16.9% | 12.4%(+4.56)#2 | 5.8%(+11.2)#419 |
| 3. | 20024 | 16.7% | 12.4%(+4.33)#3 | 5.8%(+10.9)#438 |
| 4. | 20001 | 16.6% | 12.4%(+4.28)#4 | 5.8%(+10.9)#450 |
| 5. | 20007 | 14.8% | 12.4%(+2.39)#5 | 5.8%(+8.99)#633 |
| 6. | 20009 | 14.5% | 12.4%(+2.10)#6 | 5.8%(+8.70)#674 |
| 7. | 20036 | 14.4% | 12.4%(+2.00)#7 | 5.8%(+8.60)#690 |
| 8. | 20008 | 13.2% | 12.4%(+0.795)#8 | 5.8%(+7.40)#903 |
| 9. | 20037 | 12.9% | 12.4%(+0.502)#9 | 5.8%(+7.11)#969 |
| 10. | 20015 | 12.4% | 12.4%(-0.016)#10 | 5.8%(+6.59)#1,096 |
| 11. | 20002 | 12.2% | 12.4%(-0.180)#11 | 5.8%(+6.42)#1,149 |
| 12. | 20011 | 11.5% | 12.4%(-0.898)#12 | 5.8%(+5.71)#1,429 |
| 13. | 20016 | 11.2% | 12.4%(-1.15)#13 | 5.8%(+5.45)#1,548 |
| 14. | 20010 | 11.0% | 12.4%(-1.40)#14 | 5.8%(+5.20)#1,668 |
| 15. | 20017 | 10.5% | 12.4%(-1.82)#15 | 5.8%(+4.78)#1,872 |
| 16. | 20006 | 10.1% | 12.4%(-2.22)#16 | 5.8%(+4.38)#2,096 |
| 17. | 20018 | 9.7% | 12.4%(-2.62)#17 | 5.8%(+3.98)#2,398 |
| 18. | 20012 | 8.9% | 12.4%(-3.47)#18 | 5.8%(+3.14)#3,184 |
| 19. | 20052 | 8.5% | 12.4%(-3.84)#19 | 5.8%(+2.76)#3,574 |
| 20. | 20064 | 8.5% | 12.4%(-3.88)#20 | 5.8%(+2.73)#3,603 |
| 21. | 20019 | 8.1% | 12.4%(-4.30)#21 | 5.8%(+2.30)#4,164 |
| 22. | 20004 | 7.7% | 12.4%(-4.70)#22 | 5.8%(+1.91)#4,732 |
| 23. | 20020 | 7.1% | 12.4%(-5.31)#23 | 5.8%(+1.29)#5,733 |
| 24. | 20032 | 7.1% | 12.4%(-5.32)#24 | 5.8%(+1.29)#5,742 |
| 25. | 20057 | 2.1% | 12.4%(-10.3)#25 | 5.8%(-3.66)#21,407 |
| 26. | 20059 | 1.9% | 12.4%(-10.5)#26 | 5.8%(-3.88)#22,240 |
1
Common Questions
What are the Top 10 Zip Codes with the Highest Percentage of Population Employed in Business & Financial in Washington, DC?
Top 10 Zip Codes with the Highest Percentage of Population Employed in Business & Financial in Washington, DC are:
What zip code has the Highest Percentage of Population Employed in Business & Financial in Washington, DC?
20005 has the Highest Percentage of Population Employed in Business & Financial in Washington, DC with 19.6%.
What is the Percentage of Population Employed in Business & Financial in Washington, DC?
Percentage of Population Employed in Business & Financial in Washington is 12.4%.
What is the Percentage of Population Employed in Business & Financial in District Of Columbia?
Percentage of Population Employed in Business & Financial in District Of Columbia is 12.4%.
What is the Percentage of Population Employed in Business & Financial in the United States?
Percentage of Population Employed in Business & Financial in the United States is 5.8%.