Zip Codes with the Highest Percentage of Population with a Degree in Social Sciences in Washington, DC

RELATED REPORTS & OPTIONS

Social Sciences
Population
Families and Households
Female Fertility
Female Fertility (Unmarried)
Race (Community Size)
Race (Percentage)
Ancestry (Community Size)
AfghanAfricanAlbanianAlsatianAmericanApacheArabArgentineanArmenianAssyrian / Chaldean / SyriacAustralianAustrianBahamianBarbadianBasqueBelgianBelizeanBermudanBhutaneseBlackfeetBolivianBrazilianBritishBritish West IndianBulgarianBurmeseCajunCambodianCanadianCape VerdeanCelticCentral AmericanCentral American IndianCherokeeChickasawChileanChineseChippewaChoctawColombianCosta RicanCreeCreekCroatianCubanCypriotCzechCzechoslovakianDanishDominicanDutchEastern EuropeanEcuadorianEgyptianEnglishEstonianEthiopianEuropeanFilipinoFinnishFrenchFrench American IndianFrench CanadianGermanGhanaianGreekGuamanian / ChamorroGuatemalanGuyaneseHaitianHonduranHungarianIcelanderIndian (Asian)IndonesianIranianIraqiIrishIroquoisIsraeliItalianJamaicanJapaneseJordanianKenyanKoreanLaotianLatvianLebaneseLiberianLithuanianLumbeeLuxembourgerMacedonianMalaysianMalteseMexicanMexican American IndianMongolianMoroccanNative HawaiianNavajoNew ZealanderNicaraguanNigerianNorthern EuropeanNorwegianOkinawanPakistaniPalestinianPanamanianParaguayanPennsylvania GermanPeruvianPolishPortuguesePuebloPuerto RicanRomanianRussianSalvadoranSamoanScandinavianScotch-IrishScottishSeminoleSenegaleseSerbianSierra LeoneanSlavicSlovakSloveneSomaliSouth AfricanSouth AmericanSouth American IndianSpaniardSpanishSri LankanSubsaharan AfricanSudaneseSwedishSwissSyrianThaiTlingit-HaidaTrinidadian and TobagonianTurkishU.S. Virgin IslanderUgandanUkrainianUruguayanVenezuelanVietnameseWelshWest IndianYugoslavianZimbabwean
Ancestry (Percentage)
AfghanAfricanAlbanianAlsatianAmericanApacheArabArgentineanArmenianAssyrian / Chaldean / SyriacAustralianAustrianBahamianBarbadianBasqueBelgianBelizeanBermudanBhutaneseBlackfeetBolivianBrazilianBritishBritish West IndianBulgarianBurmeseCajunCambodianCanadianCape VerdeanCelticCentral AmericanCentral American IndianCherokeeChickasawChileanChineseChippewaChoctawColombianCosta RicanCreeCreekCroatianCubanCypriotCzechCzechoslovakianDanishDominicanDutchEastern EuropeanEcuadorianEgyptianEnglishEstonianEthiopianEuropeanFilipinoFinnishFrenchFrench American IndianFrench CanadianGermanGhanaianGreekGuamanian / ChamorroGuatemalanGuyaneseHaitianHonduranHungarianIcelanderIndian (Asian)IndonesianIranianIraqiIrishIroquoisIsraeliItalianJamaicanJapaneseJordanianKenyanKoreanLaotianLatvianLebaneseLiberianLithuanianLumbeeLuxembourgerMacedonianMalaysianMalteseMexicanMexican American IndianMongolianMoroccanNative HawaiianNavajoNew ZealanderNicaraguanNigerianNorthern EuropeanNorwegianOkinawanPakistaniPalestinianPanamanianParaguayanPennsylvania GermanPeruvianPolishPortuguesePuebloPuerto RicanRomanianRussianSalvadoranSamoanScandinavianScotch-IrishScottishSeminoleSenegaleseSerbianSierra LeoneanSlavicSlovakSloveneSomaliSouth AfricanSouth AmericanSouth American IndianSpaniardSpanishSri LankanSubsaharan AfricanSudaneseSwedishSwissSyrianThaiTlingit-HaidaTrinidadian and TobagonianTurkishU.S. Virgin IslanderUgandanUkrainianUruguayanVenezuelanVietnameseWelshWest IndianYugoslavianZimbabwean
Immigrant Origin (Total)
AfghanistanAfricaAlbaniaArgentinaArmeniaAsiaAustraliaAustriaBahamasBangladeshBarbadosBelarusBelgiumBelizeBoliviaBrazilBulgariaBurma / MyanmarCambodiaCameroonCanadaCaribbeanCentral AmericaChileChinaColombiaCongoCosta RicaCroatiaCubaCzechoslovakiaDenmarkDominicaDominican RepublicEastern AfricaEastern AsiaEastern EuropeEcuadorEgyptEl SalvadorEnglandEritreaEthiopiaEuropeFranceGermanyGhanaGreeceGrenadaGuatemalaGuyanaHaitiHondurasHong KongHungaryIndiaIndonesiaIranIraqIrelandIsraelItalyJamaicaJapanJordanKazakhstanKenyaKoreaKuwaitLatin AmericaLatviaLebanonLiberiaLithuaniaMalaysiaMexicoMiddle AfricaMoroccoNepalNetherlandsNicaraguaNigeriaNorthern AfricaNorthern EuropeNorwayOceaniaPakistanPanamaPeruPhilippinesPolandPortugalRomaniaRussiaSaudi ArabiaScotlandSenegalSerbiaSierra LeoneSingaporeSomaliaSouth AfricaSouth AmericaSouth Central AsiaSouth Eastern AsiaSouthern EuropeSpainSri LankaSt. Vincent and the GrenadinesSudanSwedenSwitzerlandSyriaTaiwanThailandTrinidad and TobagoTurkeyUgandaUkraineUruguayUzbekistanVenezuelaVietnamWest IndiesWestern AfricaWestern AsiaWestern EuropeZaireZimbabwe
Immigrant Origin (Percentage)
AfghanistanAfricaAlbaniaArgentinaArmeniaAsiaAustraliaAustriaBahamasBangladeshBarbadosBelarusBelgiumBelizeBoliviaBrazilBulgariaBurma / MyanmarCambodiaCameroonCanadaCaribbeanCentral AmericaChileChinaColombiaCongoCosta RicaCroatiaCubaCzechoslovakiaDenmarkDominicaDominican RepublicEastern AfricaEastern AsiaEastern EuropeEcuadorEgyptEl SalvadorEnglandEritreaEthiopiaEuropeFranceGermanyGhanaGreeceGrenadaGuatemalaGuyanaHaitiHondurasHong KongHungaryIndiaIndonesiaIranIraqIrelandIsraelItalyJamaicaJapanJordanKazakhstanKenyaKoreaKuwaitLatin AmericaLatviaLebanonLiberiaLithuaniaMalaysiaMexicoMiddle AfricaMoroccoNepalNetherlandsNicaraguaNigeriaNorthern AfricaNorthern EuropeNorwayOceaniaPakistanPanamaPeruPhilippinesPolandPortugalRomaniaRussiaSaudi ArabiaScotlandSenegalSerbiaSierra LeoneSingaporeSomaliaSouth AfricaSouth AmericaSouth Central AsiaSouth Eastern AsiaSouthern EuropeSpainSri LankaSt. Vincent and the GrenadinesSudanSwedenSwitzerlandSyriaTaiwanThailandTrinidad and TobagoTurkeyUgandaUkraineUruguayUzbekistanVenezuelaVietnamWest IndiesWestern AfricaWestern AsiaWestern EuropeZaireZimbabwe
Income
Income (Families)
Income (Households)
Poverty
Poverty (Families)
Unemployment
Employment Occupations
Employment Industries
Employer Class
Commute Time
Commute Means
School Enrollment
Education by Degree Field
Occupancy
Finances
Physical Characteristics
Washington
Compare Zip Codes
Comparison Subject

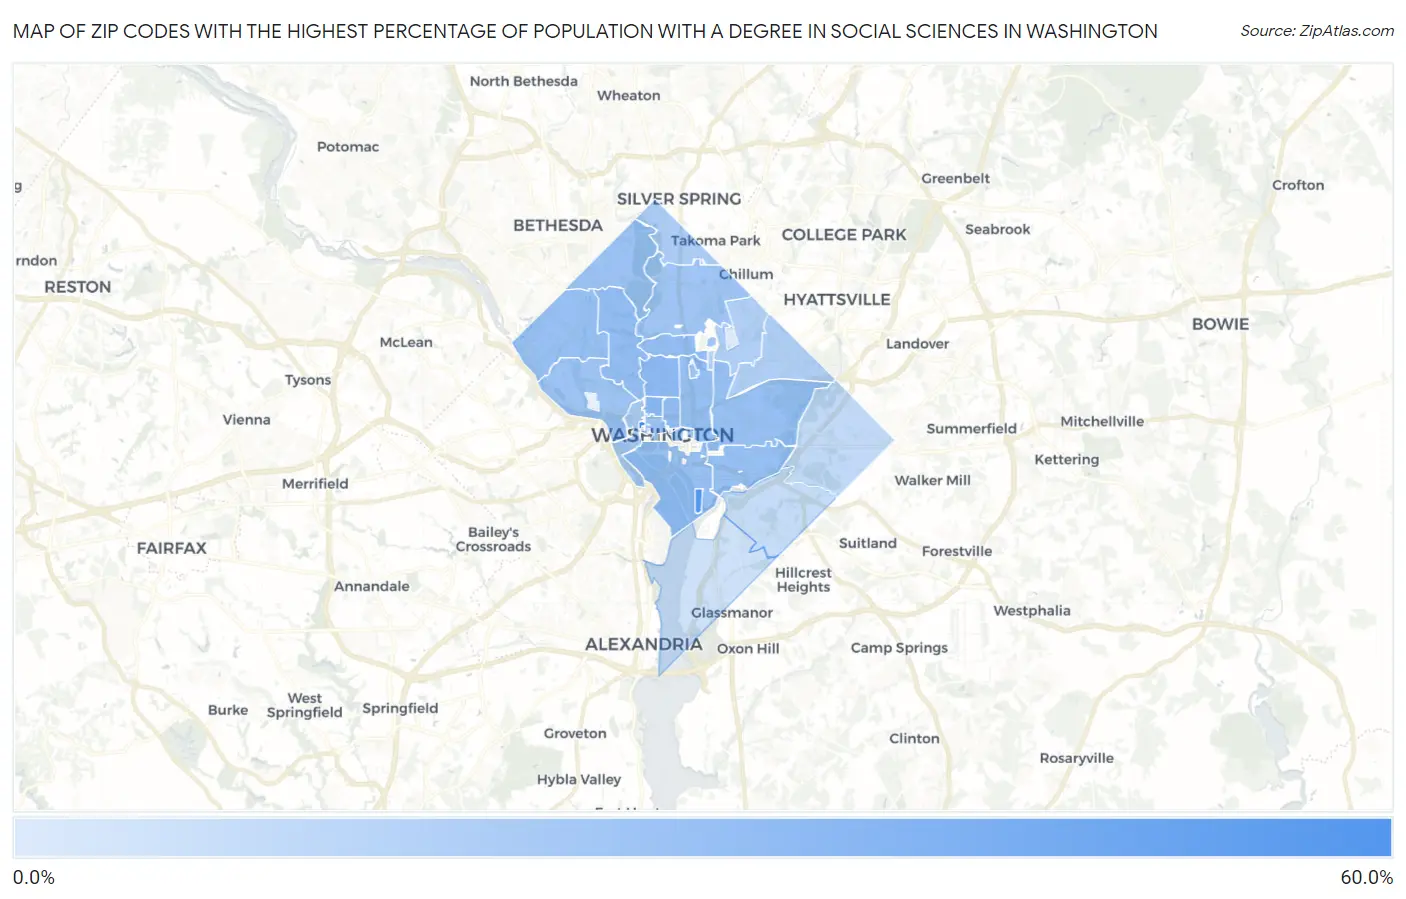
Map of Zip Codes with the Highest Percentage of Population with a Degree in Social Sciences in Washington

0.0%
60.0%
Zip Codes with the Highest Percentage of Population with a Degree in Social Sciences in Washington Map

Zip Codes with the Highest Percentage of Population with a Degree in Social Sciences in Washington, DC

Zip Code % Graduates vs State vs National
1.2005255.0%26.0%(+29.0)#18.1%(+46.9)#118
2.2031950.0%26.0%(+24.0)#28.1%(+41.9)#163
3.2003632.5%26.0%(+6.48)#38.1%(+24.4)#372
4.2000931.0%26.0%(+4.95)#48.1%(+22.9)#407
5.2000529.6%26.0%(+3.60)#58.1%(+21.5)#439
6.2001028.6%26.0%(+2.56)#68.1%(+20.5)#469
7.2000828.5%26.0%(+2.50)#78.1%(+20.4)#477
8.2000128.2%26.0%(+2.21)#88.1%(+20.1)#484
9.2000227.5%26.0%(+1.46)#98.1%(+19.4)#511
10.2002427.5%26.0%(+1.46)#108.1%(+19.4)#512
11.2000327.5%26.0%(+1.45)#118.1%(+19.4)#513
12.2001627.4%26.0%(+1.39)#128.1%(+19.3)#515
13.2001526.6%26.0%(+0.558)#138.1%(+18.5)#561
14.2000626.3%26.0%(+0.256)#148.1%(+18.2)#578
15.2005925.0%26.0%(-1.01)#158.1%(+16.9)#630
16.2000724.9%26.0%(-1.15)#168.1%(+16.8)#655
17.2001124.2%26.0%(-1.77)#178.1%(+16.2)#674
18.2000423.5%26.0%(-2.47)#188.1%(+15.5)#713
19.2003722.5%26.0%(-3.48)#198.1%(+14.5)#782
20.2001220.5%26.0%(-5.49)#208.1%(+12.5)#915
21.2001820.4%26.0%(-5.57)#218.1%(+12.4)#924
22.2001719.4%26.0%(-6.64)#228.1%(+11.3)#1,040
23.2042217.4%26.0%(-8.62)#238.1%(+9.32)#1,334
24.2001914.7%26.0%(-11.3)#248.1%(+6.66)#2,049
25.2002013.5%26.0%(-12.5)#258.1%(+5.45)#2,583
26.2003211.2%26.0%(-14.8)#268.1%(+3.15)#4,150
27.200647.3%26.0%(-18.7)#278.1%(-0.779)#10,231

Common Questions

What are the Top 10 Zip Codes with the Highest Percentage of Population with a Degree in Social Sciences in Washington, DC?
Top 10 Zip Codes with the Highest Percentage of Population with a Degree in Social Sciences in Washington, DC are:
#1
55.0%
#2
50.0%
#3
32.5%
#4
31.0%
#5
29.6%
#6
28.6%
#7
28.5%
#8
28.2%
#9
27.5%
#10
27.5%
What zip code has the Highest Percentage of Population with a Degree in Social Sciences in Washington, DC?
20052 has the Highest Percentage of Population with a Degree in Social Sciences in Washington, DC with 55.0%.
What is the Percentage of Population with a Degree in Social Sciences in Washington, DC?
Percentage of Population with a Degree in Social Sciences in Washington is 26.0%.
What is the Percentage of Population with a Degree in Social Sciences in District Of Columbia?
Percentage of Population with a Degree in Social Sciences in District Of Columbia is 26.0%.
What is the Percentage of Population with a Degree in Social Sciences in the United States?
Percentage of Population with a Degree in Social Sciences in the United States is 8.1%.