Zip Codes with the Highest Percentage of Population with a Degree in Literature and Languages in Hesperia, CA
RELATED REPORTS & OPTIONS
Literature and Languages
Hesperia
Compare Zip Codes
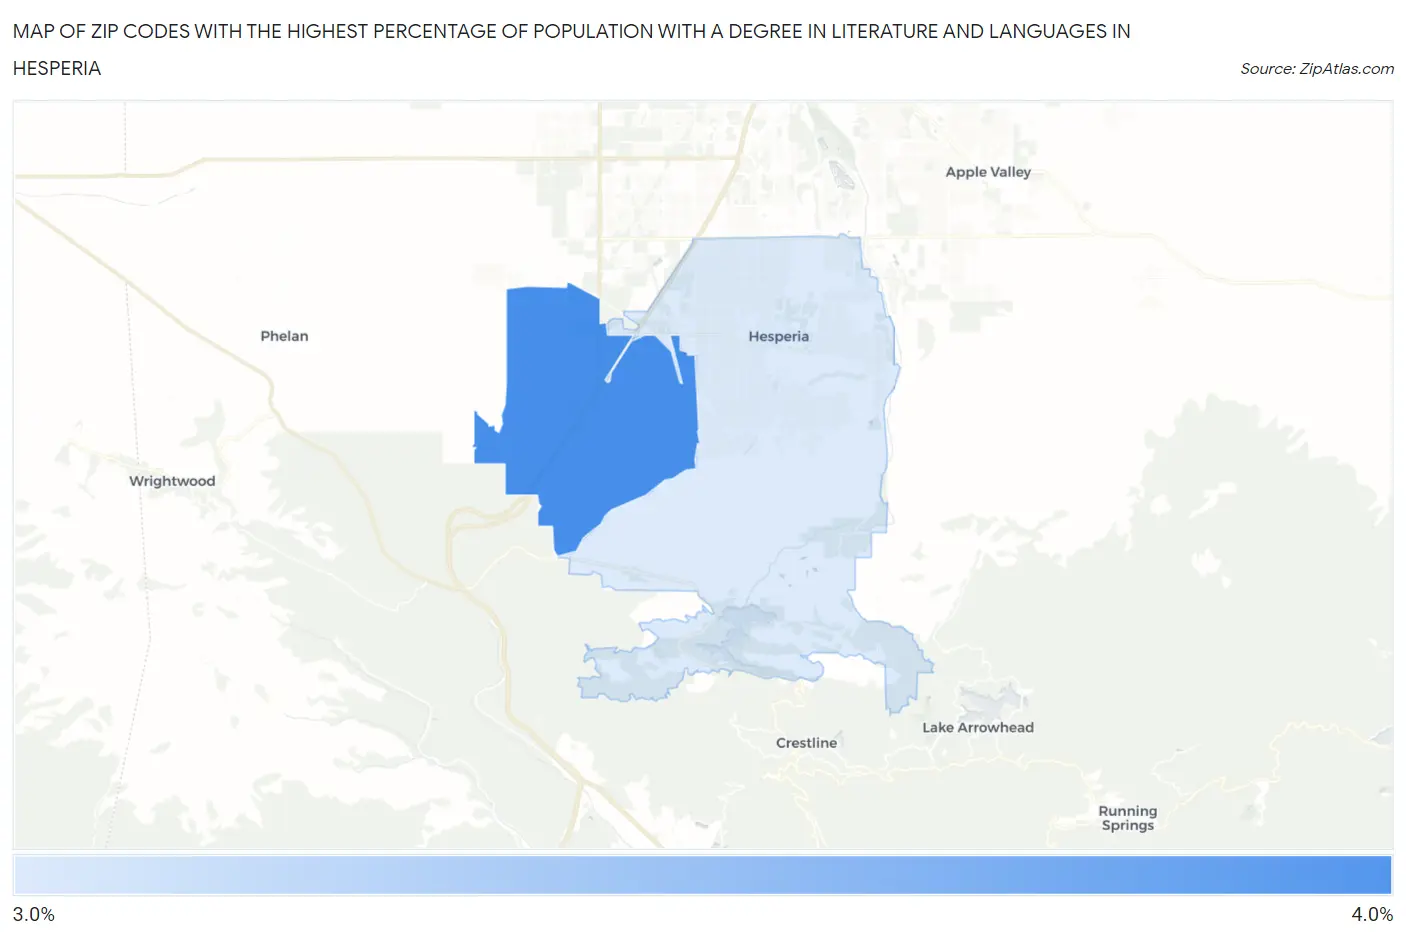
Map of Zip Codes with the Highest Percentage of Population with a Degree in Literature and Languages in Hesperia
3.1%
3.5%
Zip Codes with the Highest Percentage of Population with a Degree in Literature and Languages in Hesperia, CA
| Zip Code | % Graduates | vs State | vs National | |
| 1. | 92344 | 3.5% | 5.1%(-1.58)#1,075 | 4.4%(-0.909)#11,848 |
| 2. | 92345 | 3.1% | 5.1%(-1.97)#1,146 | 4.4%(-1.29)#13,162 |
1
Common Questions
What are the Top Zip Codes with the Highest Percentage of Population with a Degree in Literature and Languages in Hesperia, CA?
Top Zip Codes with the Highest Percentage of Population with a Degree in Literature and Languages in Hesperia, CA are:
What zip code has the Highest Percentage of Population with a Degree in Literature and Languages in Hesperia, CA?
92344 has the Highest Percentage of Population with a Degree in Literature and Languages in Hesperia, CA with 3.5%.
What is the Percentage of Population with a Degree in Literature and Languages in Hesperia, CA?
Percentage of Population with a Degree in Literature and Languages in Hesperia is 3.3%.
What is the Percentage of Population with a Degree in Literature and Languages in California?
Percentage of Population with a Degree in Literature and Languages in California is 5.1%.
What is the Percentage of Population with a Degree in Literature and Languages in the United States?
Percentage of Population with a Degree in Literature and Languages in the United States is 4.4%.