Zip Codes with the Highest Percentage of Population Employed in Arts, Media & Entertainment in Hesperia, CA
RELATED REPORTS & OPTIONS
Arts, Media & Entertainment
Hesperia
Compare Zip Codes
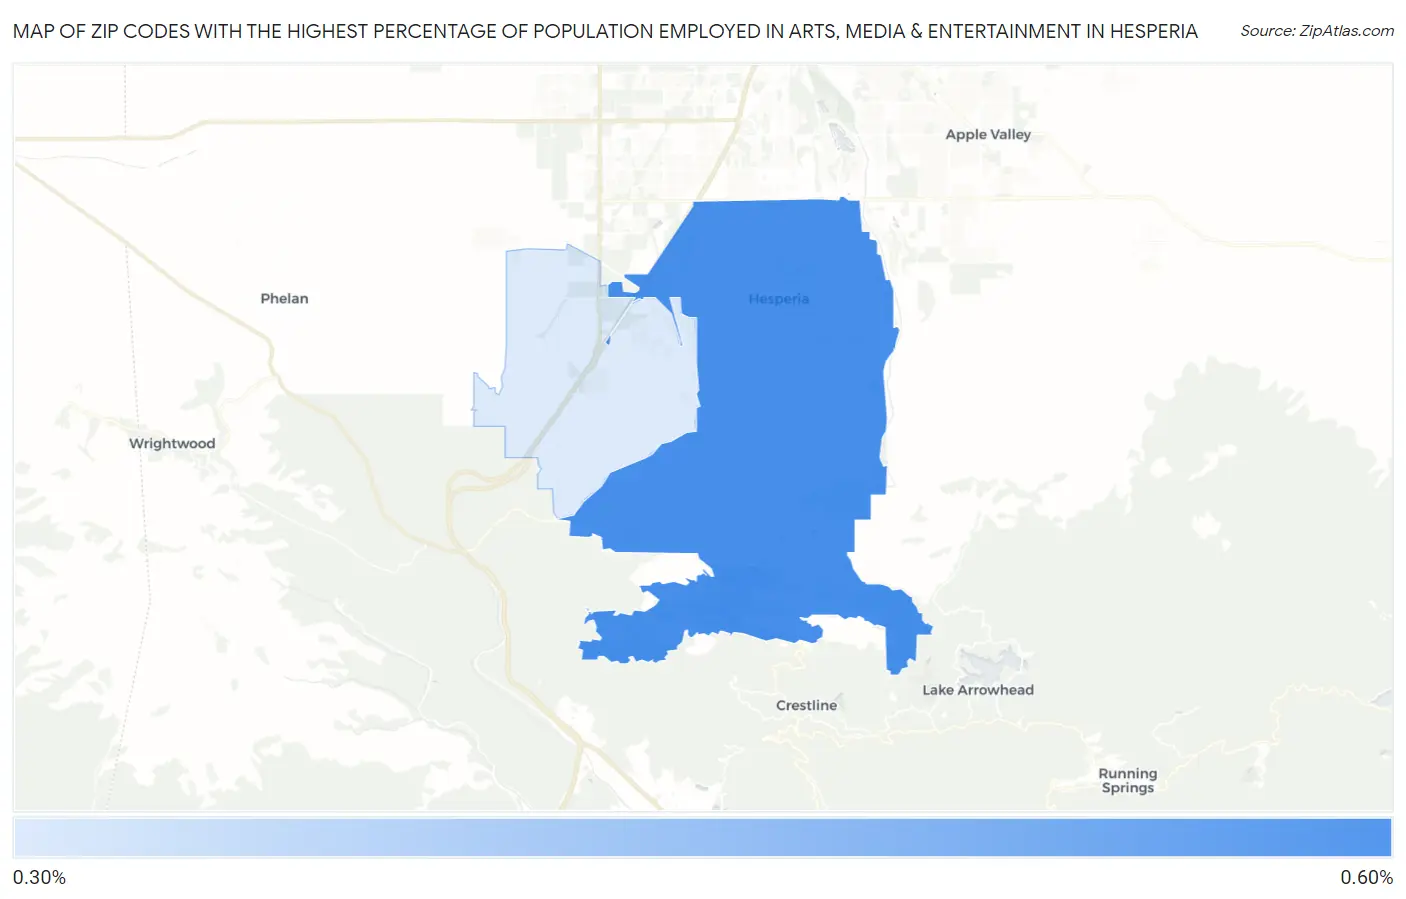
Map of Zip Codes with the Highest Percentage of Population Employed in Arts, Media & Entertainment in Hesperia
0.37%
0.58%
Zip Codes with the Highest Percentage of Population Employed in Arts, Media & Entertainment in Hesperia, CA
| Zip Code | % Employed | vs State | vs National | |
| 1. | 92345 | 0.58% | 3.0%(-2.38)#1,269 | 2.1%(-1.48)#18,179 |
| 2. | 92344 | 0.37% | 3.0%(-2.59)#1,310 | 2.1%(-1.69)#19,850 |
1
Common Questions
What are the Top Zip Codes with the Highest Percentage of Population Employed in Arts, Media & Entertainment in Hesperia, CA?
Top Zip Codes with the Highest Percentage of Population Employed in Arts, Media & Entertainment in Hesperia, CA are:
What zip code has the Highest Percentage of Population Employed in Arts, Media & Entertainment in Hesperia, CA?
92345 has the Highest Percentage of Population Employed in Arts, Media & Entertainment in Hesperia, CA with 0.58%.
What is the Percentage of Population Employed in Arts, Media & Entertainment in Hesperia, CA?
Percentage of Population Employed in Arts, Media & Entertainment in Hesperia is 0.59%.
What is the Percentage of Population Employed in Arts, Media & Entertainment in California?
Percentage of Population Employed in Arts, Media & Entertainment in California is 3.0%.
What is the Percentage of Population Employed in Arts, Media & Entertainment in the United States?
Percentage of Population Employed in Arts, Media & Entertainment in the United States is 2.1%.