Zip Codes with the Highest Percentage of Population Employed in Accommodation & Food Services in Avondale, AZ
RELATED REPORTS & OPTIONS
Accommodation & Food Services
Avondale
Compare Zip Codes
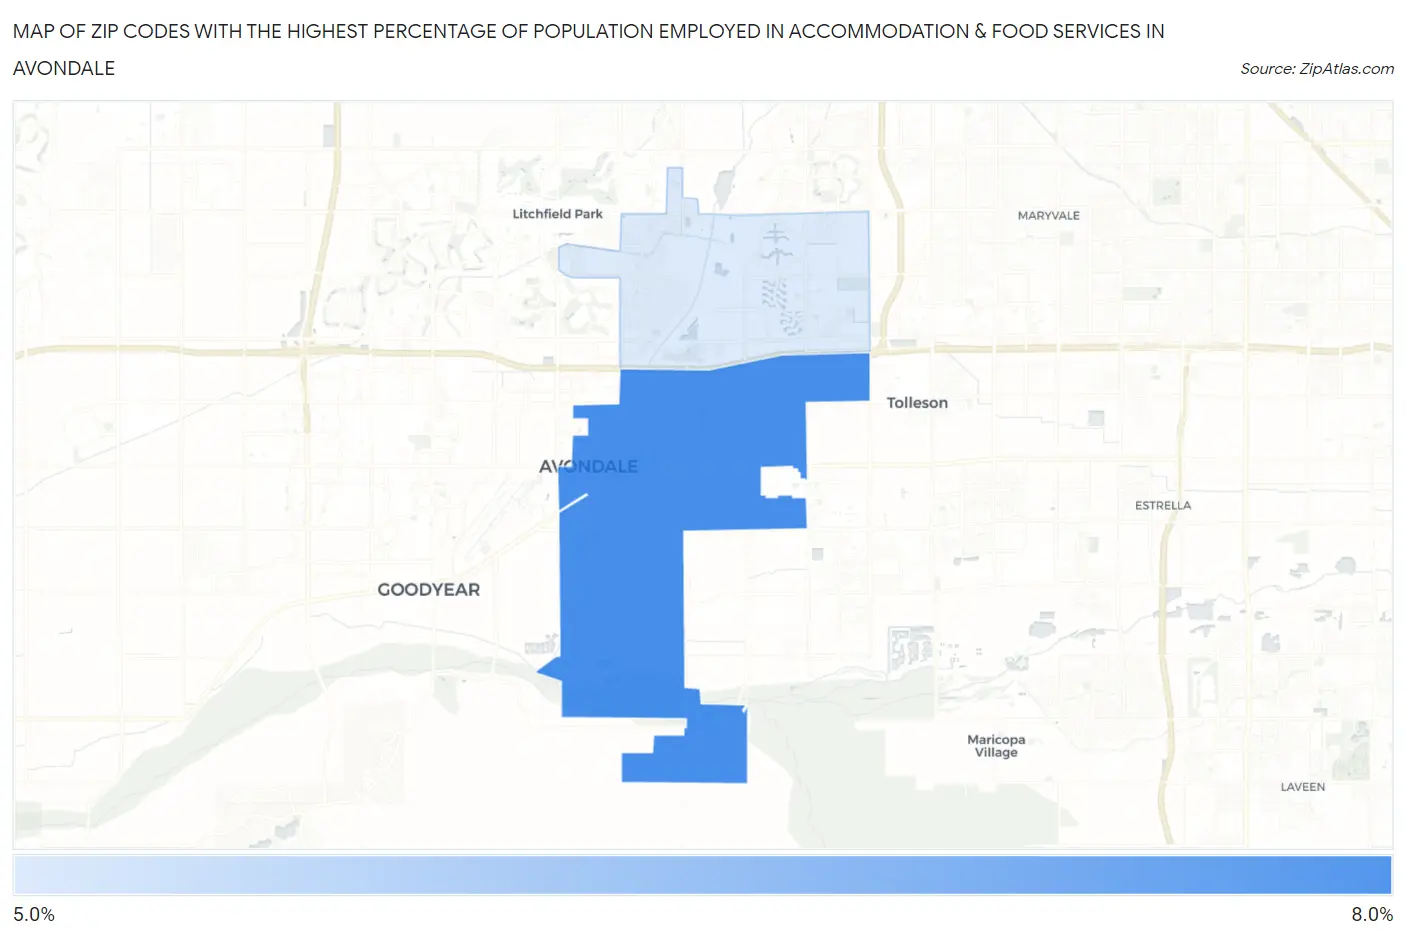
Map of Zip Codes with the Highest Percentage of Population Employed in Accommodation & Food Services in Avondale
5.1%
6.8%
Zip Codes with the Highest Percentage of Population Employed in Accommodation & Food Services in Avondale, AZ
| Zip Code | % Employed | vs State | vs National | |
| 1. | 85323 | 6.8% | 7.6%(-0.711)#197 | 6.9%(-0.038)#10,743 |
| 2. | 85392 | 5.1% | 7.6%(-2.50)#284 | 6.9%(-1.83)#16,637 |
1
Common Questions
What are the Top Zip Codes with the Highest Percentage of Population Employed in Accommodation & Food Services in Avondale, AZ?
Top Zip Codes with the Highest Percentage of Population Employed in Accommodation & Food Services in Avondale, AZ are:
What zip code has the Highest Percentage of Population Employed in Accommodation & Food Services in Avondale, AZ?
85323 has the Highest Percentage of Population Employed in Accommodation & Food Services in Avondale, AZ with 6.8%.
What is the Percentage of Population Employed in Accommodation & Food Services in Avondale, AZ?
Percentage of Population Employed in Accommodation & Food Services in Avondale is 5.9%.
What is the Percentage of Population Employed in Accommodation & Food Services in Arizona?
Percentage of Population Employed in Accommodation & Food Services in Arizona is 7.6%.
What is the Percentage of Population Employed in Accommodation & Food Services in the United States?
Percentage of Population Employed in Accommodation & Food Services in the United States is 6.9%.