Zip Codes with the Highest Percentage of Population Employed in Accommodation & Food Services in Peoria, AZ
RELATED REPORTS & OPTIONS
Accommodation & Food Services
Peoria
Compare Zip Codes
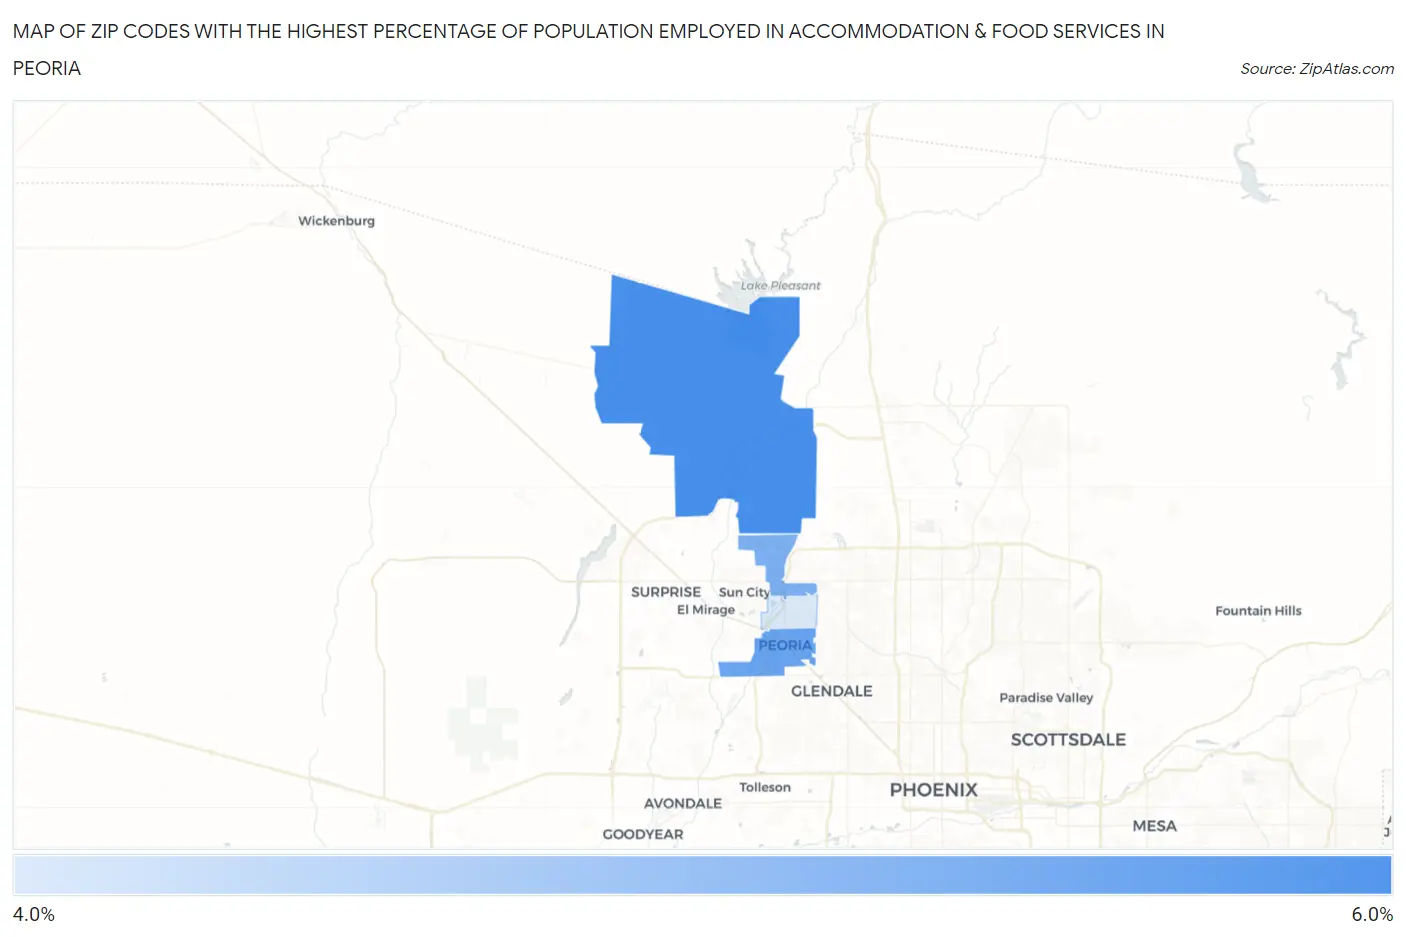
Map of Zip Codes with the Highest Percentage of Population Employed in Accommodation & Food Services in Peoria
4.9%
6.0%
Zip Codes with the Highest Percentage of Population Employed in Accommodation & Food Services in Peoria, AZ
| Zip Code | % Employed | vs State | vs National | |
| 1. | 85383 | 6.0% | 7.6%(-1.60)#243 | 6.9%(-0.924)#13,590 |
| 2. | 85345 | 5.7% | 7.6%(-1.85)#256 | 6.9%(-1.18)#14,389 |
| 3. | 85382 | 5.6% | 7.6%(-1.98)#264 | 6.9%(-1.30)#14,779 |
| 4. | 85381 | 4.9% | 7.6%(-2.66)#288 | 6.9%(-1.99)#17,184 |
1
Common Questions
What are the Top 3 Zip Codes with the Highest Percentage of Population Employed in Accommodation & Food Services in Peoria, AZ?
Top 3 Zip Codes with the Highest Percentage of Population Employed in Accommodation & Food Services in Peoria, AZ are:
What zip code has the Highest Percentage of Population Employed in Accommodation & Food Services in Peoria, AZ?
85383 has the Highest Percentage of Population Employed in Accommodation & Food Services in Peoria, AZ with 6.0%.
What is the Percentage of Population Employed in Accommodation & Food Services in Peoria, AZ?
Percentage of Population Employed in Accommodation & Food Services in Peoria is 5.6%.
What is the Percentage of Population Employed in Accommodation & Food Services in Arizona?
Percentage of Population Employed in Accommodation & Food Services in Arizona is 7.6%.
What is the Percentage of Population Employed in Accommodation & Food Services in the United States?
Percentage of Population Employed in Accommodation & Food Services in the United States is 6.9%.