Zip Codes with the Highest Percentage of Population Employed in Arts, Entertainment & Recreation in Benton, AR
RELATED REPORTS & OPTIONS
Arts, Entertainment & Recreation
Benton
Compare Zip Codes
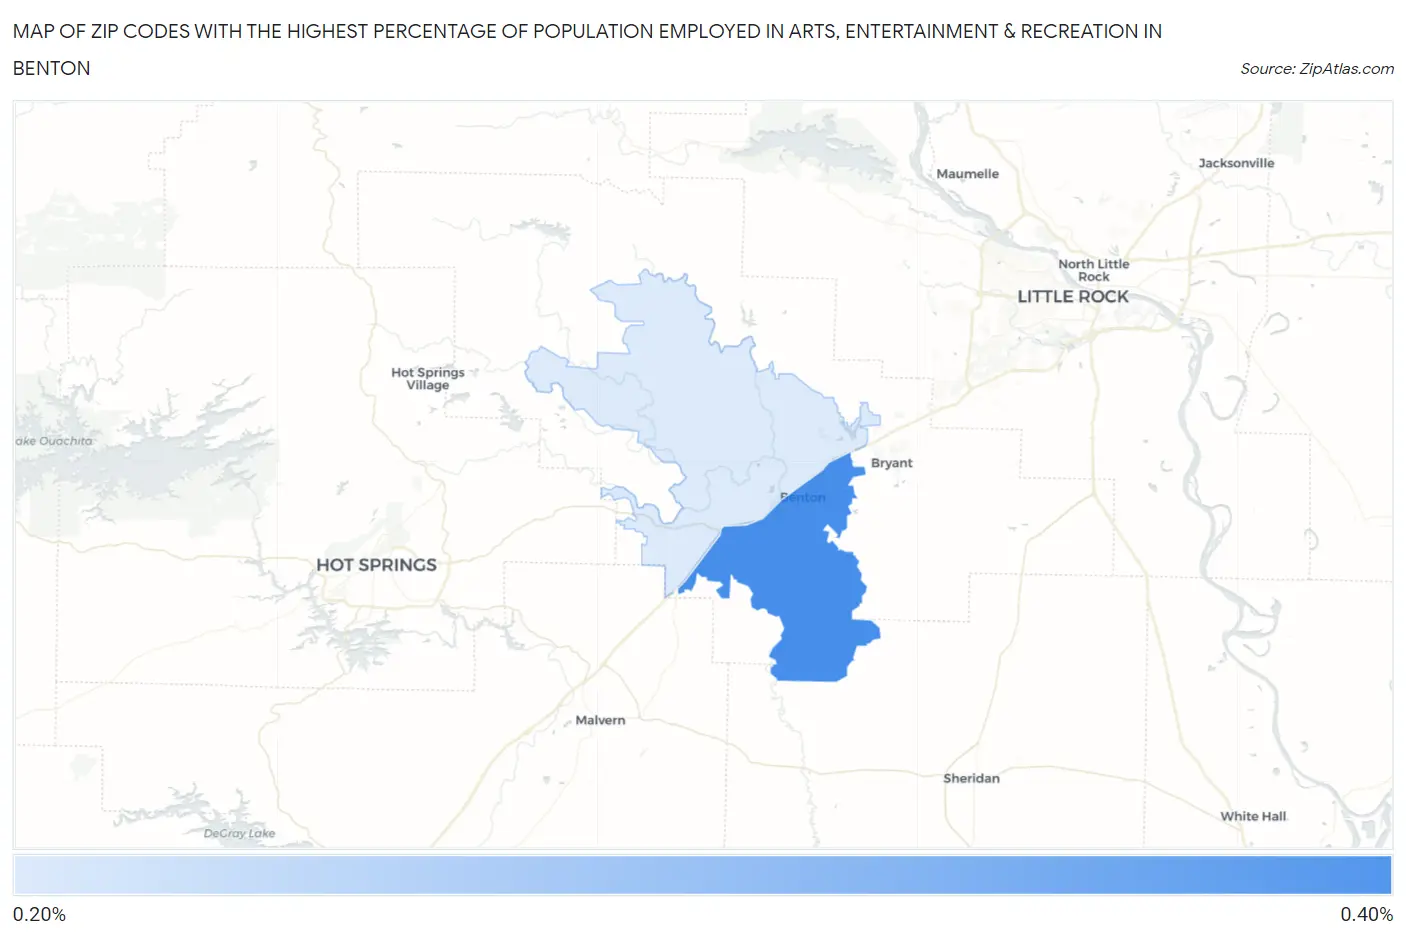
Map of Zip Codes with the Highest Percentage of Population Employed in Arts, Entertainment & Recreation in Benton
0.30%
0.34%
Zip Codes with the Highest Percentage of Population Employed in Arts, Entertainment & Recreation in Benton, AR
| Zip Code | % Employed | vs State | vs National | |
| 1. | 72015 | 0.34% | 1.3%(-0.960)#253 | 2.1%(-1.75)#21,515 |
| 2. | 72019 | 0.30% | 1.3%(-0.998)#258 | 2.1%(-1.78)#21,731 |
1
Common Questions
What are the Top Zip Codes with the Highest Percentage of Population Employed in Arts, Entertainment & Recreation in Benton, AR?
Top Zip Codes with the Highest Percentage of Population Employed in Arts, Entertainment & Recreation in Benton, AR are:
What zip code has the Highest Percentage of Population Employed in Arts, Entertainment & Recreation in Benton, AR?
72015 has the Highest Percentage of Population Employed in Arts, Entertainment & Recreation in Benton, AR with 0.34%.
What is the Percentage of Population Employed in Arts, Entertainment & Recreation in Benton, AR?
Percentage of Population Employed in Arts, Entertainment & Recreation in Benton is 0.29%.
What is the Percentage of Population Employed in Arts, Entertainment & Recreation in Arkansas?
Percentage of Population Employed in Arts, Entertainment & Recreation in Arkansas is 1.3%.
What is the Percentage of Population Employed in Arts, Entertainment & Recreation in the United States?
Percentage of Population Employed in Arts, Entertainment & Recreation in the United States is 2.1%.