Zip Codes with the Highest Percentage of Households Heated by Electricity in Benton, AR
RELATED REPORTS & OPTIONS
Electrical Heating
Benton
Compare Zip Codes
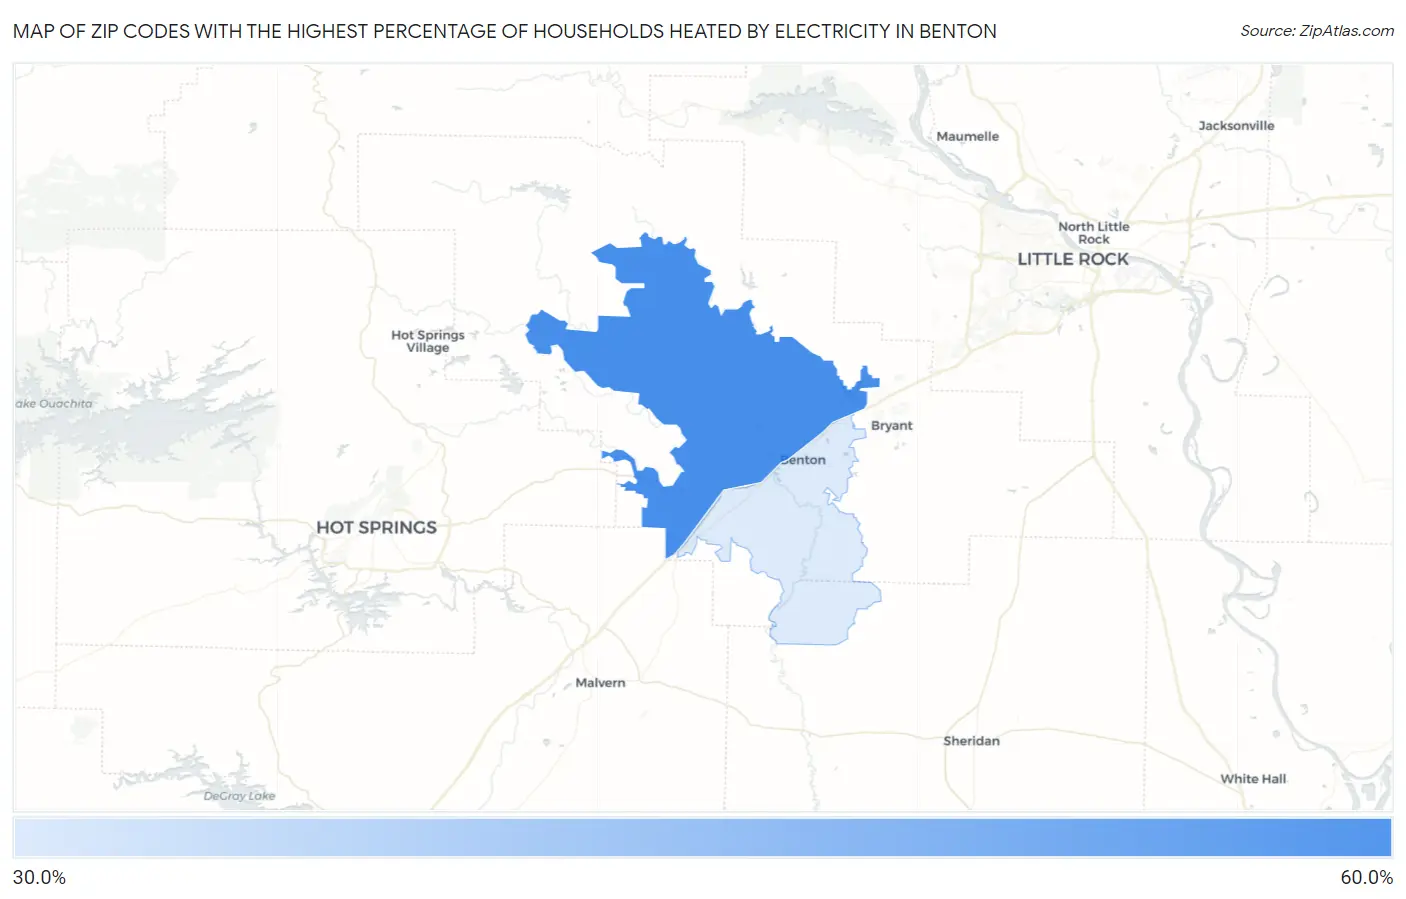
Map of Zip Codes with the Highest Percentage of Households Heated by Electricity in Benton
34.7%
53.5%
Zip Codes with the Highest Percentage of Households Heated by Electricity in Benton, AR
| Zip Code | Electrical Heating | vs State | vs National | |
| 1. | 72019 | 53.5% | 52.5%(+1.00)#254 | 40.2%(+13.3)#9,028 |
| 2. | 72015 | 34.7% | 52.5%(-17.8)#479 | 40.2%(-5.50)#14,335 |
1
Common Questions
What are the Top Zip Codes with the Highest Percentage of Households Heated by Electricity in Benton, AR?
Top Zip Codes with the Highest Percentage of Households Heated by Electricity in Benton, AR are:
What zip code has the Highest Percentage of Households Heated by Electricity in Benton, AR?
72019 has the Highest Percentage of Households Heated by Electricity in Benton, AR with 53.5%.
What is the Percentage of Households Heated by Electricity in Benton, AR?
Percentage of Households Heated by Electricity in Benton is 40.5%.
What is the Percentage of Households Heated by Electricity in Arkansas?
Percentage of Households Heated by Electricity in Arkansas is 52.5%.
What is the Percentage of Households Heated by Electricity in the United States?
Percentage of Households Heated by Electricity in the United States is 40.2%.