Zip Codes with the Highest Percentage of Population with a Degree in Communications in Benton, AR
RELATED REPORTS & OPTIONS
Communications
Benton
Compare Zip Codes
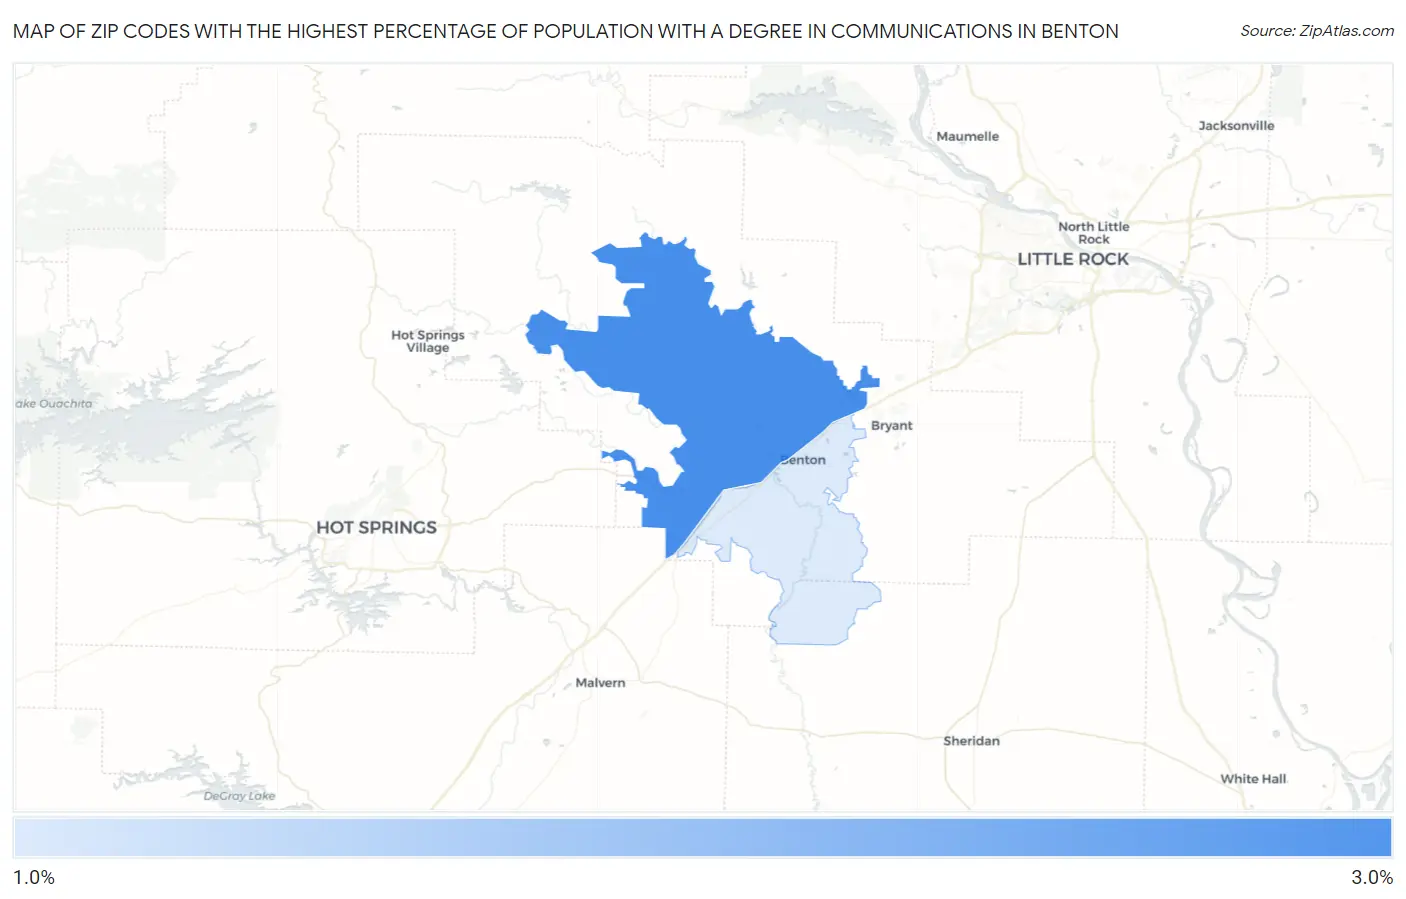
Map of Zip Codes with the Highest Percentage of Population with a Degree in Communications in Benton
1.8%
2.9%
Zip Codes with the Highest Percentage of Population with a Degree in Communications in Benton, AR
| Zip Code | % Graduates | vs State | vs National | |
| 1. | 72019 | 2.9% | 3.3%(-0.328)#137 | 4.1%(-1.20)#12,454 |
| 2. | 72015 | 1.8% | 3.3%(-1.44)#178 | 4.1%(-2.31)#16,471 |
1
Common Questions
What are the Top Zip Codes with the Highest Percentage of Population with a Degree in Communications in Benton, AR?
Top Zip Codes with the Highest Percentage of Population with a Degree in Communications in Benton, AR are:
What zip code has the Highest Percentage of Population with a Degree in Communications in Benton, AR?
72019 has the Highest Percentage of Population with a Degree in Communications in Benton, AR with 2.9%.
What is the Percentage of Population with a Degree in Communications in Benton, AR?
Percentage of Population with a Degree in Communications in Benton is 1.8%.
What is the Percentage of Population with a Degree in Communications in Arkansas?
Percentage of Population with a Degree in Communications in Arkansas is 3.3%.
What is the Percentage of Population with a Degree in Communications in the United States?
Percentage of Population with a Degree in Communications in the United States is 4.1%.