Zip Codes with the Highest Percentage of Population Employed in Agriculture, Fishing & Hunting in Benton, AR
RELATED REPORTS & OPTIONS
Agriculture, Fishing & Hunting
Benton
Compare Zip Codes
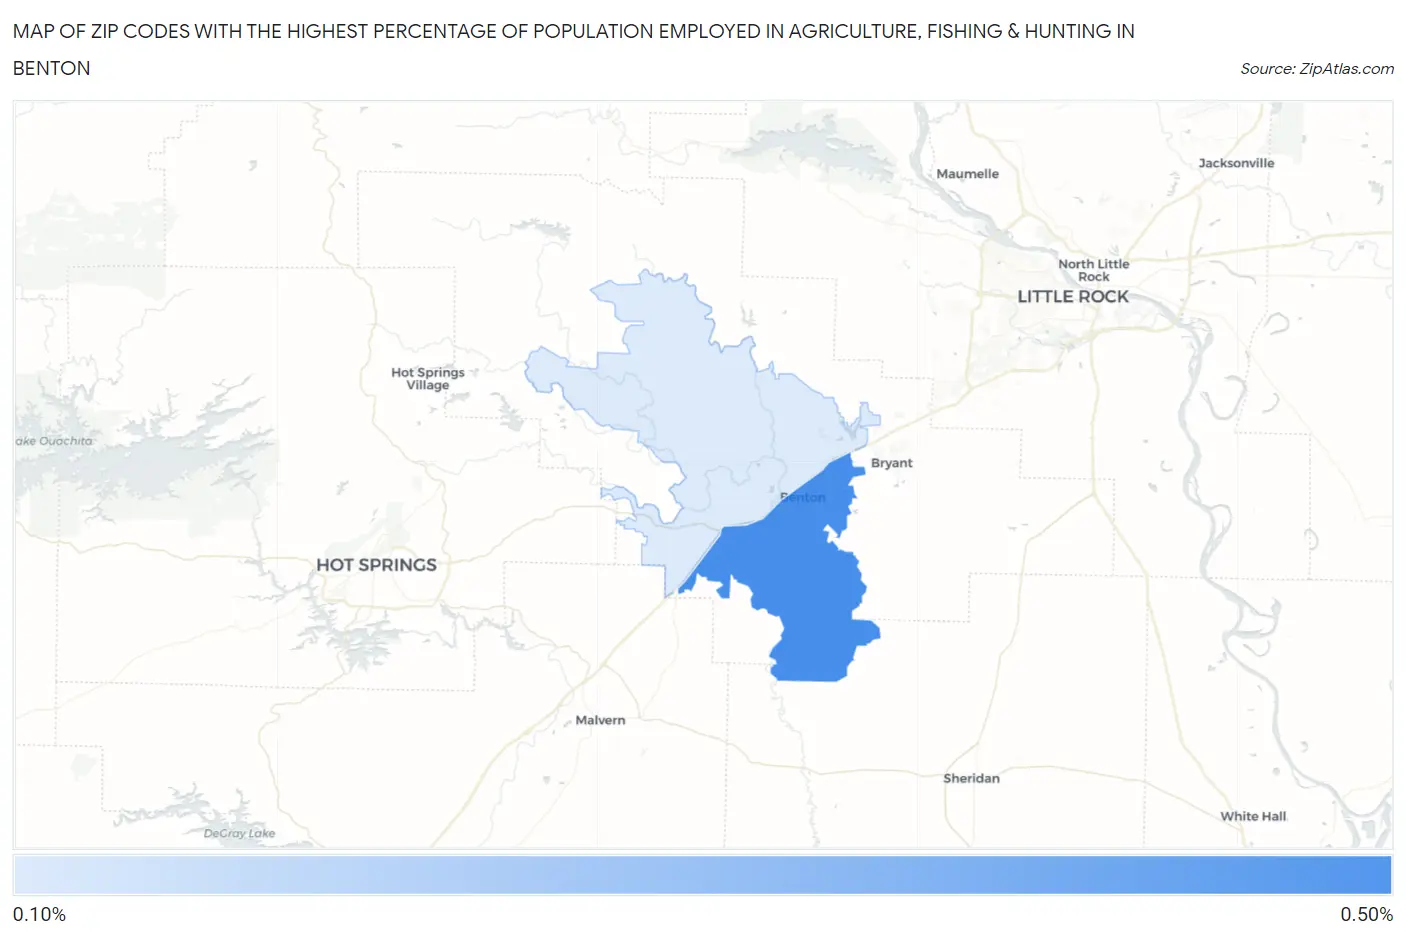
Map of Zip Codes with the Highest Percentage of Population Employed in Agriculture, Fishing & Hunting in Benton
0.13%
0.41%
Zip Codes with the Highest Percentage of Population Employed in Agriculture, Fishing & Hunting in Benton, AR
| Zip Code | % Employed | vs State | vs National | |
| 1. | 72015 | 0.41% | 2.2%(-1.77)#408 | 1.2%(-0.785)#20,025 |
| 2. | 72019 | 0.13% | 2.2%(-2.05)#436 | 1.2%(-1.07)#23,237 |
1
Common Questions
What are the Top Zip Codes with the Highest Percentage of Population Employed in Agriculture, Fishing & Hunting in Benton, AR?
Top Zip Codes with the Highest Percentage of Population Employed in Agriculture, Fishing & Hunting in Benton, AR are:
What zip code has the Highest Percentage of Population Employed in Agriculture, Fishing & Hunting in Benton, AR?
72015 has the Highest Percentage of Population Employed in Agriculture, Fishing & Hunting in Benton, AR with 0.41%.
What is the Percentage of Population Employed in Agriculture, Fishing & Hunting in Benton, AR?
Percentage of Population Employed in Agriculture, Fishing & Hunting in Benton is 0.31%.
What is the Percentage of Population Employed in Agriculture, Fishing & Hunting in Arkansas?
Percentage of Population Employed in Agriculture, Fishing & Hunting in Arkansas is 2.2%.
What is the Percentage of Population Employed in Agriculture, Fishing & Hunting in the United States?
Percentage of Population Employed in Agriculture, Fishing & Hunting in the United States is 1.2%.