Zip Codes with the Highest Percentage of Households Residing in Detached Homes in Benton, AR
RELATED REPORTS & OPTIONS
Detached Home Residency
Benton
Compare Zip Codes
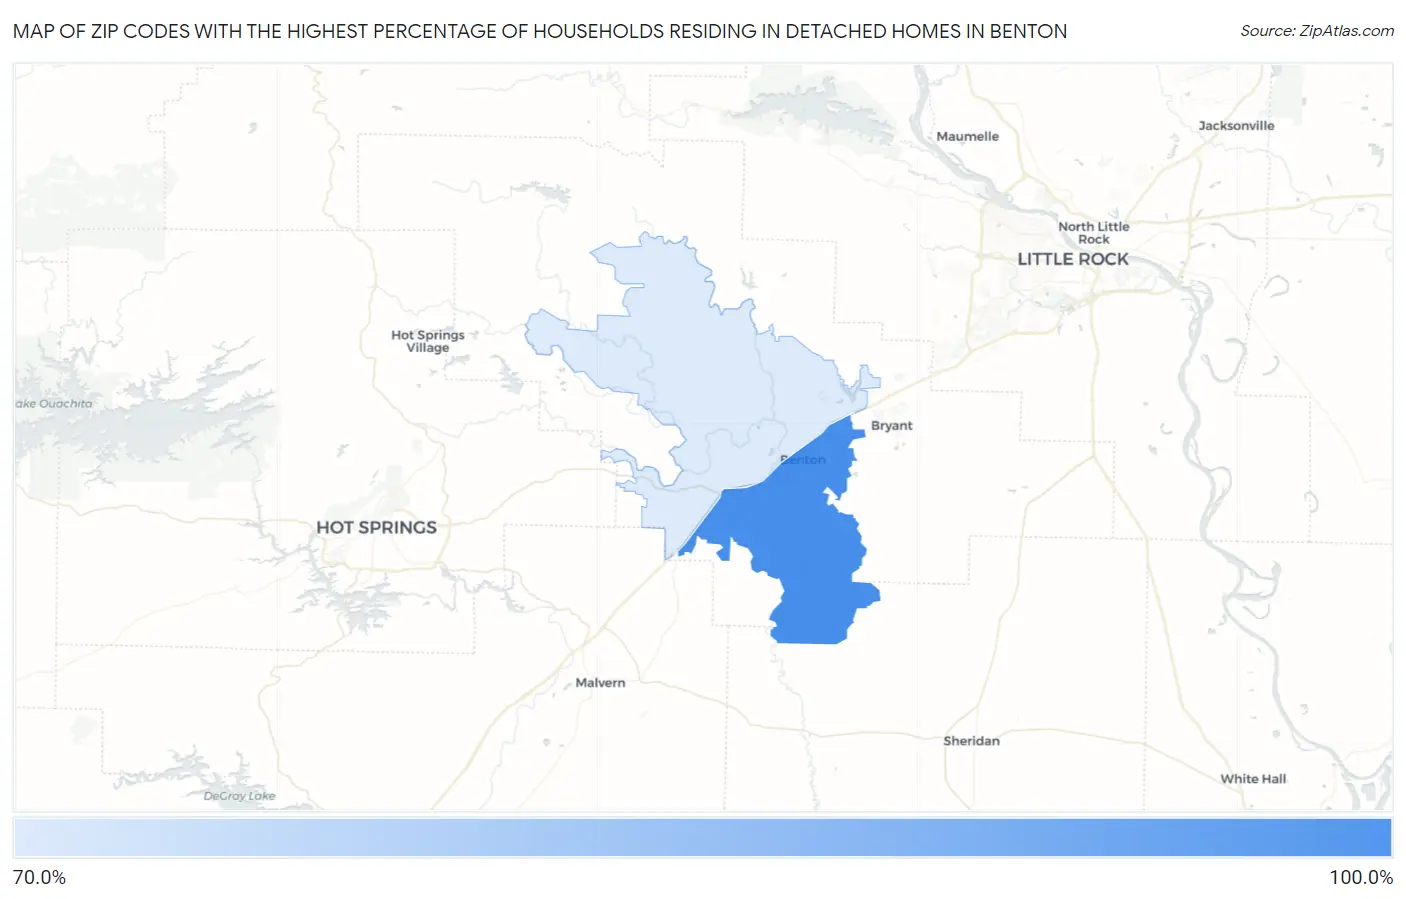
Map of Zip Codes with the Highest Percentage of Households Residing in Detached Homes in Benton
77.1%
83.6%
Zip Codes with the Highest Percentage of Households Residing in Detached Homes in Benton, AR
| Zip Code | Detached Home Residency | vs State | vs National | |
| 1. | 72015 | 83.6% | 71.4%(+12.2)#142 | 62.5%(+21.1)#11,300 |
| 2. | 72019 | 77.1% | 71.4%(+5.70)#247 | 62.5%(+14.6)#16,466 |
1
Common Questions
What are the Top Zip Codes with the Highest Percentage of Households Residing in Detached Homes in Benton, AR?
Top Zip Codes with the Highest Percentage of Households Residing in Detached Homes in Benton, AR are:
What zip code has the Highest Percentage of Households Residing in Detached Homes in Benton, AR?
72015 has the Highest Percentage of Households Residing in Detached Homes in Benton, AR with 83.6%.
What is the Percentage of Households Residing in Detached Homes in Benton, AR?
Percentage of Households Residing in Detached Homes in Benton is 78.6%.
What is the Percentage of Households Residing in Detached Homes in Arkansas?
Percentage of Households Residing in Detached Homes in Arkansas is 71.4%.
What is the Percentage of Households Residing in Detached Homes in the United States?
Percentage of Households Residing in Detached Homes in the United States is 62.5%.