Zip Codes with the Highest Percentage of Population Employed in Sales & Related in Benton, AR
RELATED REPORTS & OPTIONS
Sales & Related
Benton
Compare Zip Codes
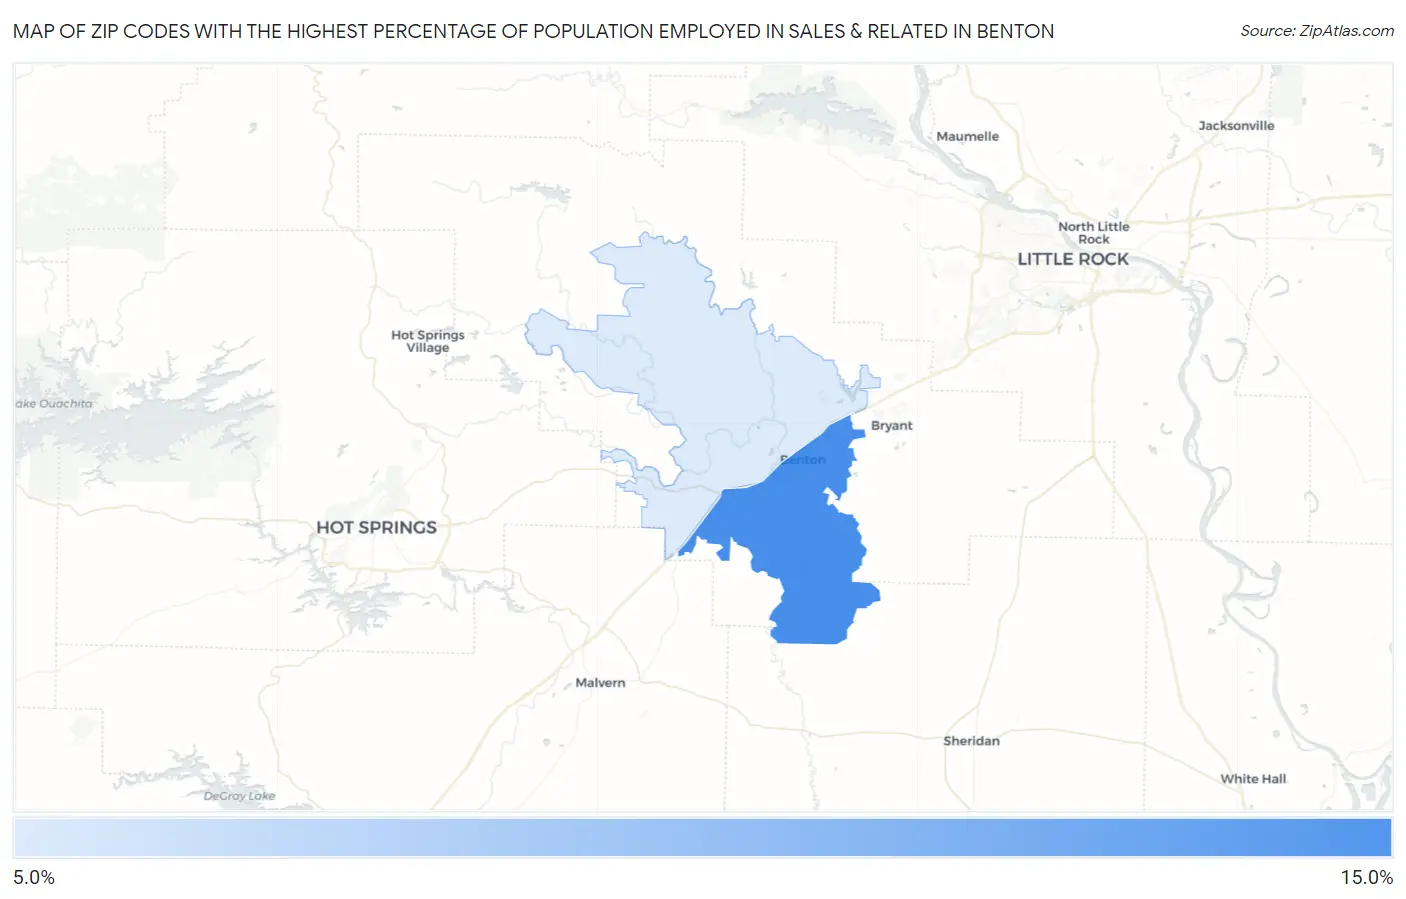
Map of Zip Codes with the Highest Percentage of Population Employed in Sales & Related in Benton
11.3%
14.0%
Zip Codes with the Highest Percentage of Population Employed in Sales & Related in Benton, AR
| Zip Code | % Employed | vs State | vs National | |
| 1. | 72015 | 14.0% | 9.8%(+4.22)#90 | 9.6%(+4.45)#3,442 |
| 2. | 72019 | 11.3% | 9.8%(+1.44)#145 | 9.6%(+1.66)#7,575 |
1
Common Questions
What are the Top Zip Codes with the Highest Percentage of Population Employed in Sales & Related in Benton, AR?
Top Zip Codes with the Highest Percentage of Population Employed in Sales & Related in Benton, AR are:
What zip code has the Highest Percentage of Population Employed in Sales & Related in Benton, AR?
72015 has the Highest Percentage of Population Employed in Sales & Related in Benton, AR with 14.0%.
What is the Percentage of Population Employed in Sales & Related in Benton, AR?
Percentage of Population Employed in Sales & Related in Benton is 14.1%.
What is the Percentage of Population Employed in Sales & Related in Arkansas?
Percentage of Population Employed in Sales & Related in Arkansas is 9.8%.
What is the Percentage of Population Employed in Sales & Related in the United States?
Percentage of Population Employed in Sales & Related in the United States is 9.6%.